Monitoring APIs with Grafana
by Kevin McGahey • February 28, 2023

Now that we have explored monitoring apis with Prometheus, let's take a look at monitoring our APIs with Grafana. You may have noticed from the previous blog that Prometheus is awesome, but takes some time to fully flesh out and their dashboards aren’t easy to read or very eye-catching. Luckily for us, Grafana specializes in data visualization. We won’t even have to configure all our Prometheus queries, so let’s get started.
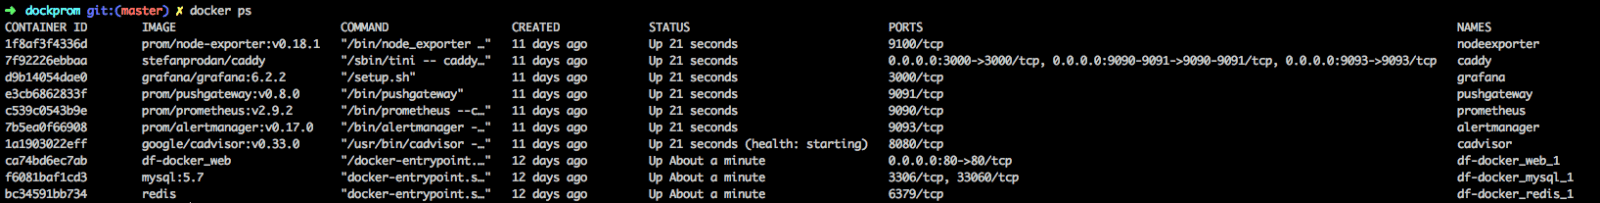
We first need to confirm everything is running. If everything is working correctly, your output should look similar to the image above. If you are not familiar with getting everything up and operating, please reference our previous blog. By navigating to 127.0.0.1:3000 you should see the Grafana home page. If you are not familiar with Grafana you may be wondering where the dashboards are. They are all located in the top left dropdown where we will see 4 pre-configured dashboards. Let’s review each of them to understand what each of them does.
Docker Host Dashboard: Monitoring APIs with Grafana
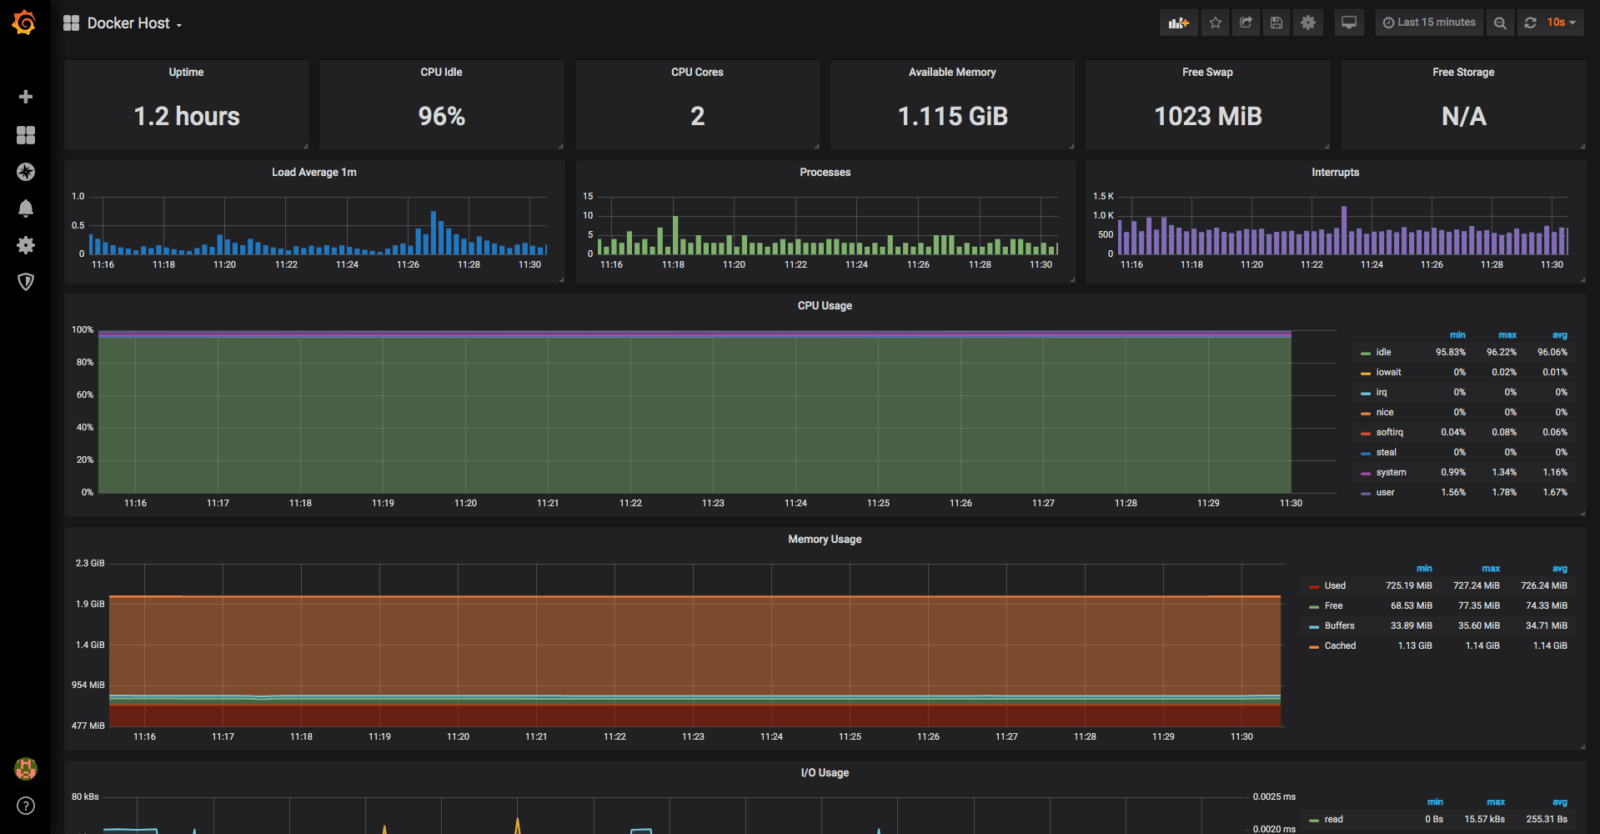
The Docker Host Dashboard is a powerful tool that provides a centralized view of the performance and health of your Docker host and its containers. With the Docker Host Dashboard, you can monitor resource usage, track network traffic, and keep an eye on the logs and events of your Docker host. This dashboard is designed to be easy to use and offers a variety of visualization options, making it an essential tool for any organization that relies on Docker for their application deployment. Thanks to dockerprom for pre-configuring all this. We can now see:
- Server uptime, CPU idle percent, number of CPU cores, available memory, swap and storage
- System load average graph, running and blocked by IO processes graph, interrupts graph
- CPU usage graph by mode (guest, idle, iowait, irq, nice, softirq, steal, system, user)
- Memory usage graph by distribution (used, free, buffers, cached)
- IO usage graph (read Bps, read Bps and IO time)
- Network usage graph by device (inbound Bps, Outbound Bps)
- Swap usage and activity graphs
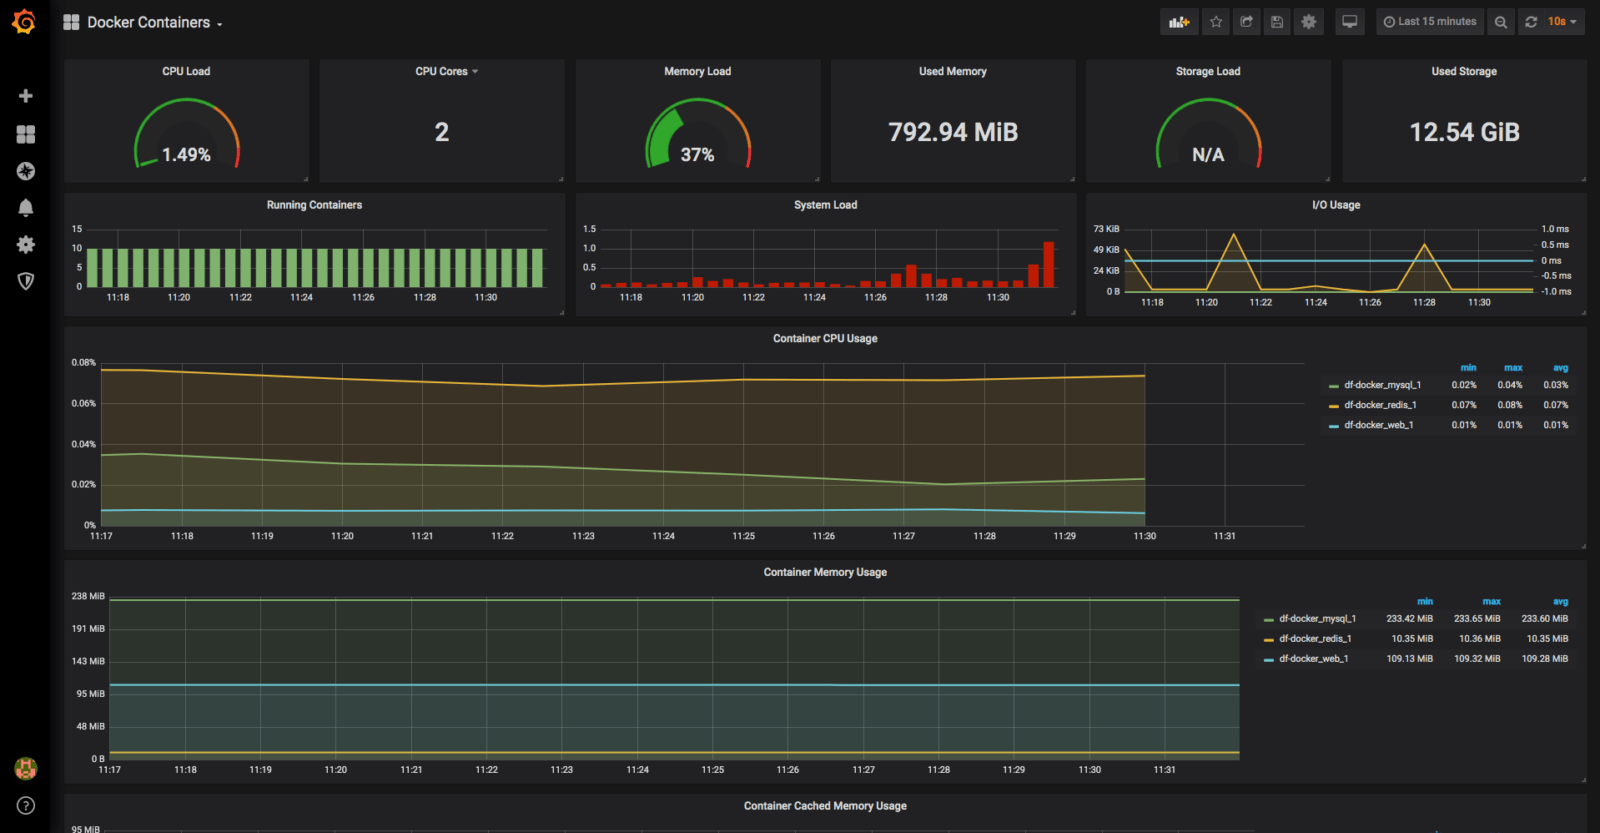
Docker Containers Dashboard
The Docker Containers Dashboard shows key metrics for monitoring running containers:
- Total containers CPU load, memory and storage usage
- Running containers graph, system load graph, IO usage graph.
- Container CPU usage graph
- Memory usage graph
- Cached memory usage graph
- Network inbound usage graph
- Container network outbound usage graph
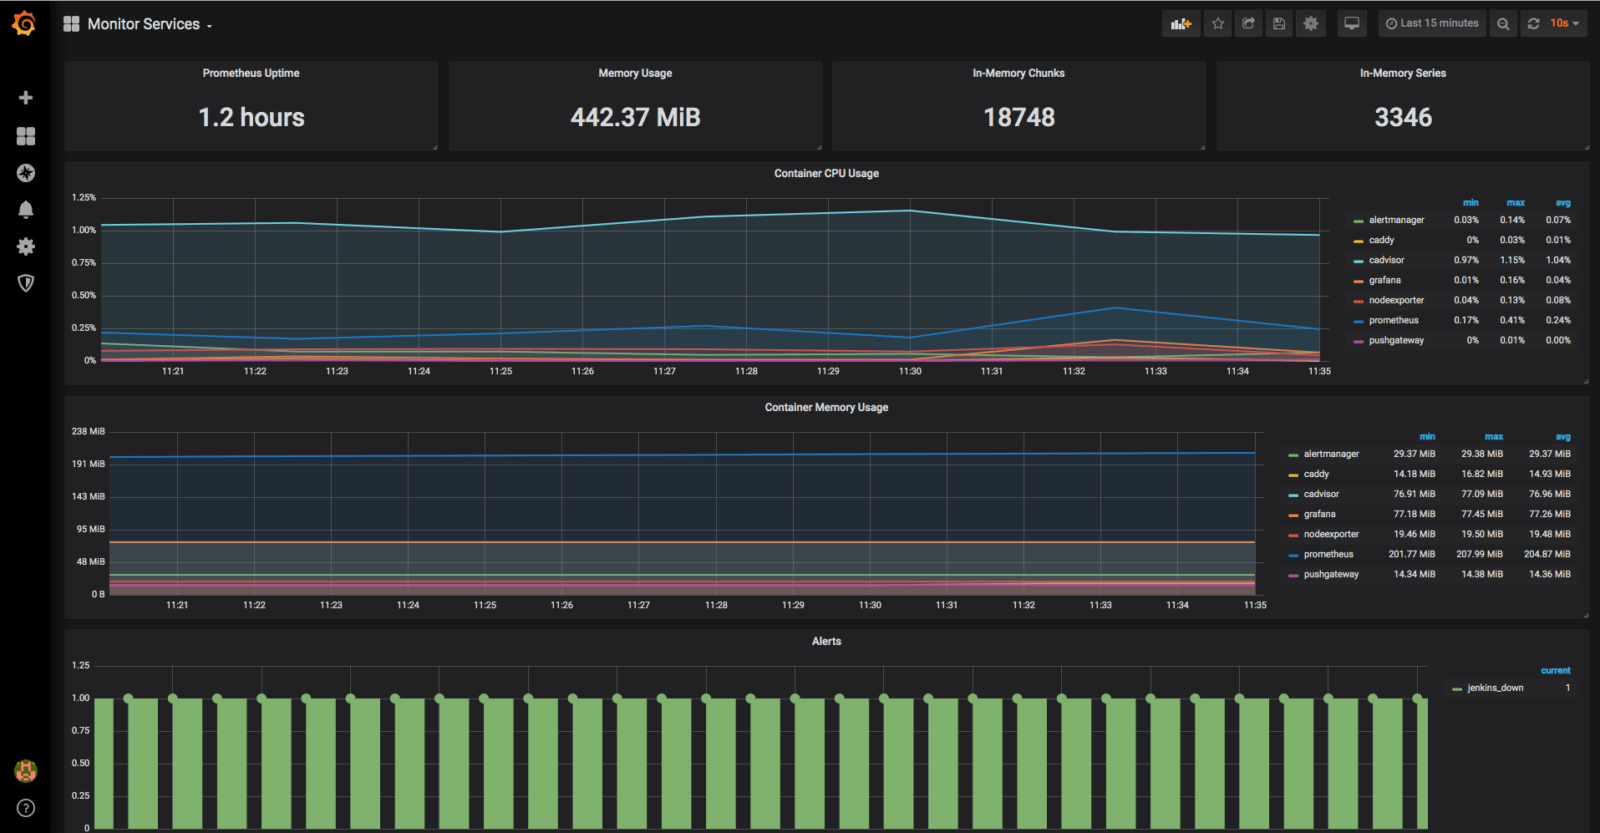
Monitor Services Dashboard
The Monitor Services Dashboard shows key metrics for monitoring the containers that make up the monitoring stack:
- Prometheus container uptime, monitoring stack total memory usage, Prometheus local storage memory chunks and series
- Container CPU usage graph
- Memory usage graph
- Prometheus chunks to persist and persistence urgency graphs
- Chunks ops and checkpoint duration graphs
- Samples ingested rate, target scrapes and scrape duration graphs
- Alerts graph
Additional Tips for monitoring APIs with Grafana
If you're looking to monitor your APIs with Grafana, here are a few tips to keep in mind to ensure that your monitoring is as effective as possible.
- It's important to identify the most critical metrics to monitor and create focused dashboards that display these metrics prominently. This will help ensure that your dashboards are easy to read and that you can quickly identify any issues with your APIs
- It's crucial to set up alerts that notify you when any metrics exceed predefined thresholds, because this will allow you to respond to issues before they become critical
- Consider leveraging the power of Grafana plugins to add new features and functionality to your monitoring setup, such as anomaly detection or advanced visualization tools
By following these tips and continuously refining your monitoring approach, you can ensure that your APIs remain performant and reliable for your end-users.
Conclusion: Monitoring APIs with Grafana
We now have a fully functioning monitoring tool with no code. Isn’t that awesome? A no code API tool and a no code data visualization tool, it can’t get much better than this. This post has only scratched the surface with regards to what you can accomplish with these tools. If you are interested in this for a Ruby application, check out our friends over at Scout who wrote a blog about doing exactly that. If you like what you see, sign up for a free trial today or contact us for more information!
RELATED ARTICLES:
Monitoring APIs with Prometheus
TL;DR - GET AN AI SUMMARY
Kevin McGahey is an accomplished solutions engineer and product lead with expertise in API generation, microservices, and legacy system modernization, as demonstrated by his successful track record of facilitating the modernization of legacy databases for numerous public sector organizations.