Monitoring APIs with Prometheus
by Kevin McGahey • February 21, 2023
Have you ever wanted a quick and easy way to monitor your Docker environment? Do you want to have an API monitor with minimal configuration? Well it looks like there has never been a better time to monitor your API as there are currently a plethora of awesome tools out there to help us with monitoring, such as Prometheus and Grafana.
Prometheus and Grafana are excellent tools for monitoring your Docker environment and APIs. With Prometheus, you can easily collect and store metrics from your API and Docker environment, whereas Grafana provides a more user-friendly interface for visualizing and exploring your data. Both tools are open-source and have an active community of contributors. You can benefit from a wealth of plugins, integrations, and pre-built dashboards. Prometheus and Grafana offer a reliable and scalable way to monitor your API and Docker environment.
If you would like to follow along with this blog start by downloading DreamFactory from our github repo, or if on-prem isn’t for you try our new hosted solution for free today!
Related: How To Maximize Your Current On-Premises Technology Investment
How to Install DreamFactory
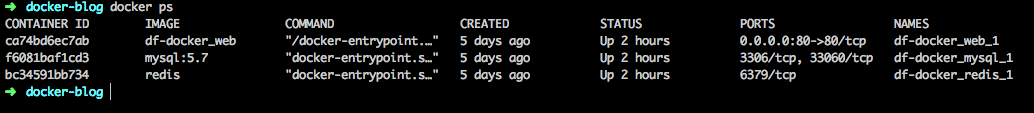
To spin up your Docker instance quickly, start by cloning our Docker repository.
git clone https://github.com/dreamfactorysoftware/df-docker.git cd df-docker
You will then want to build the image:
docker-compose build
Now that it’s built, let's start them up:
docker-compose up -d
Once you go to 127.0.0.1 in your browser, it may take some time, you will be asked to create your first admin user.
For more installation options check out our README.
Monitoring APIs with Prometheus
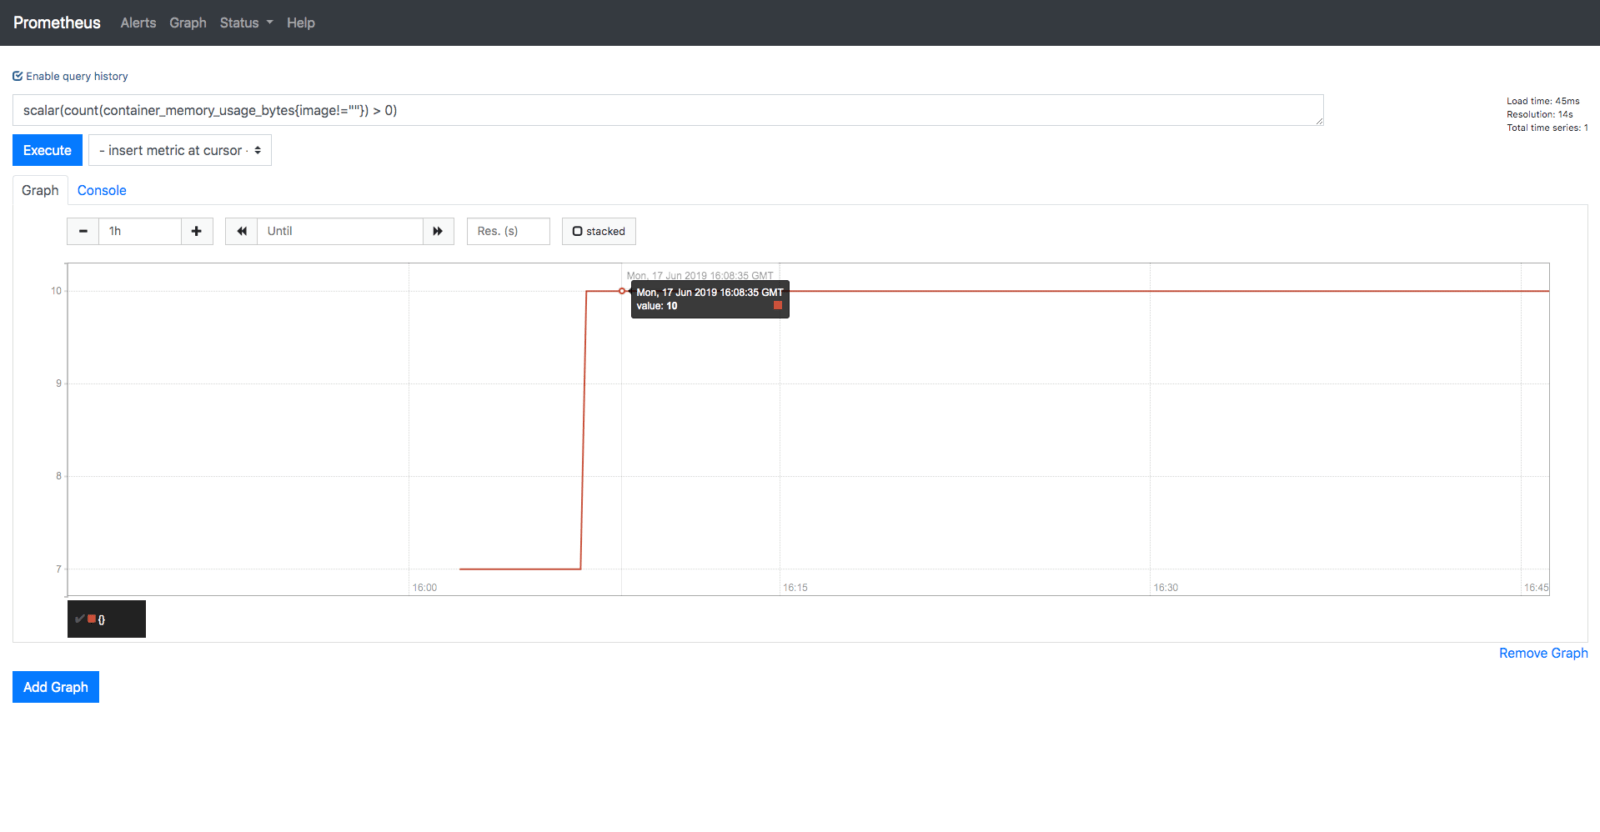
If we navigate to https://127.0.0.1:9090, we will now see Prometheus. It is an open-source systems monitoring and alerting toolkit. To see what is happening, you have to run queries. To help give you an idea of what is happening, let's start with a basic query to see how many containers are running.
scalar(count(container_memory_usage_bytes{image!=""}) > 0)
Shows we have 10 containers running and gives us a little graph.
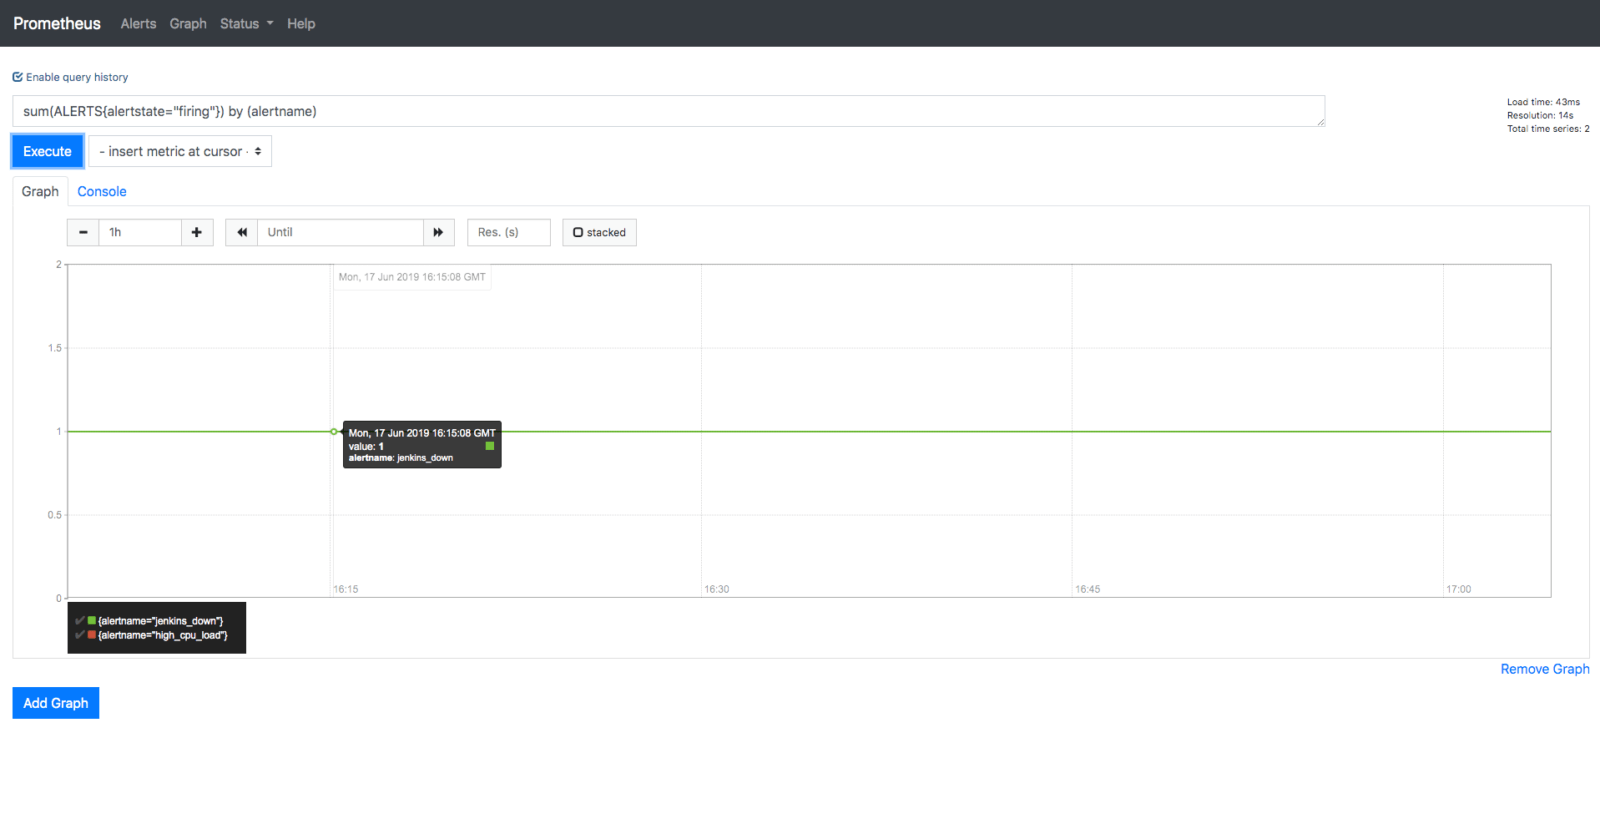
An advantage of Prometheus is alerts. To get alerts we can run:
sum(ALERTS{alertstate="firing"}) by (alertname)
This will return any active alerts that are firing letting us know if we need to take action. In my case, Jenkins is down so Prometheus is able to alert me and if anything else were to go down it can be found here.
There are plenty of other queries that can be run and I highly encourage you to explore Prometheus to see its true potential. Check out Prometheus queries yourself and create your own. If you are interested in configuring this for a Ruby application, check out our friends over at Scout who wrote a blog about doing exactly that.
Conclusion: Monitoring APIs with Prometheus
Now we have DreamFactory and Prometheus communicating. Our Prometheus dashboards are not that impressive currently, so in the next blog we will be exploring how to make Prometheus and Grafana work together to build appealing dashboards. Check back often for updates and the next blog: Monitoring APIs with Grafana.
Related reading: DreamFactory Docker Improvements!
Kevin McGahey is an accomplished solutions engineer and product lead with expertise in API generation, microservices, and legacy system modernization, as demonstrated by his successful track record of facilitating the modernization of legacy databases for numerous public sector organizations.