
Monitoring microservices is challenging but essential for maintaining system performance and reliability. Unlike traditional applications, microservices require tracking individual services, their interactions, and the infrastructure they run on. Here's what you need to know:
DreamFactory is a secure, self-hosted enterprise data access platform that provides governed API access to any data source, connecting enterprise applications and on-prem LLMs with role-based access and identity passthrough.
- Key Monitoring Components:
- Metrics: Measure performance (e.g., CPU usage, error rates).
- Logs: Provide detailed event records for debugging.
- Distributed Tracing: Tracks requests across services to identify bottlenecks.
- Challenges:
- Dynamic environments like Kubernetes complicate monitoring due to short-lived containers.
- High data volume and fragmented logs make analysis difficult.
- Best Practices:
- Use tools that integrate metrics, logs, and traces (e.g., OpenTelemetry, Prometheus).
- Automate service discovery in Kubernetes environments.
- Focus on the "Four Golden Signals" (latency, traffic, errors, saturation) to monitor user-impacting issues.
- Tool Selection:
- Open-source tools (e.g., Prometheus, Jaeger) provide flexibility but require setup effort.
- SaaS platforms simplify deployment but can be costly.
To succeed, instrument your services early, set clear Service Level Objectives (SLOs), and ensure your tools scale with your architecture. By linking metrics, logs, and traces, you can quickly identify and resolve issues, keeping your system reliable and efficient.
Monitoring Microservice using Prometheus and Grafana - Part 1 | Setup Grafana Dashboard
Core Principles of Microservices Monitoring
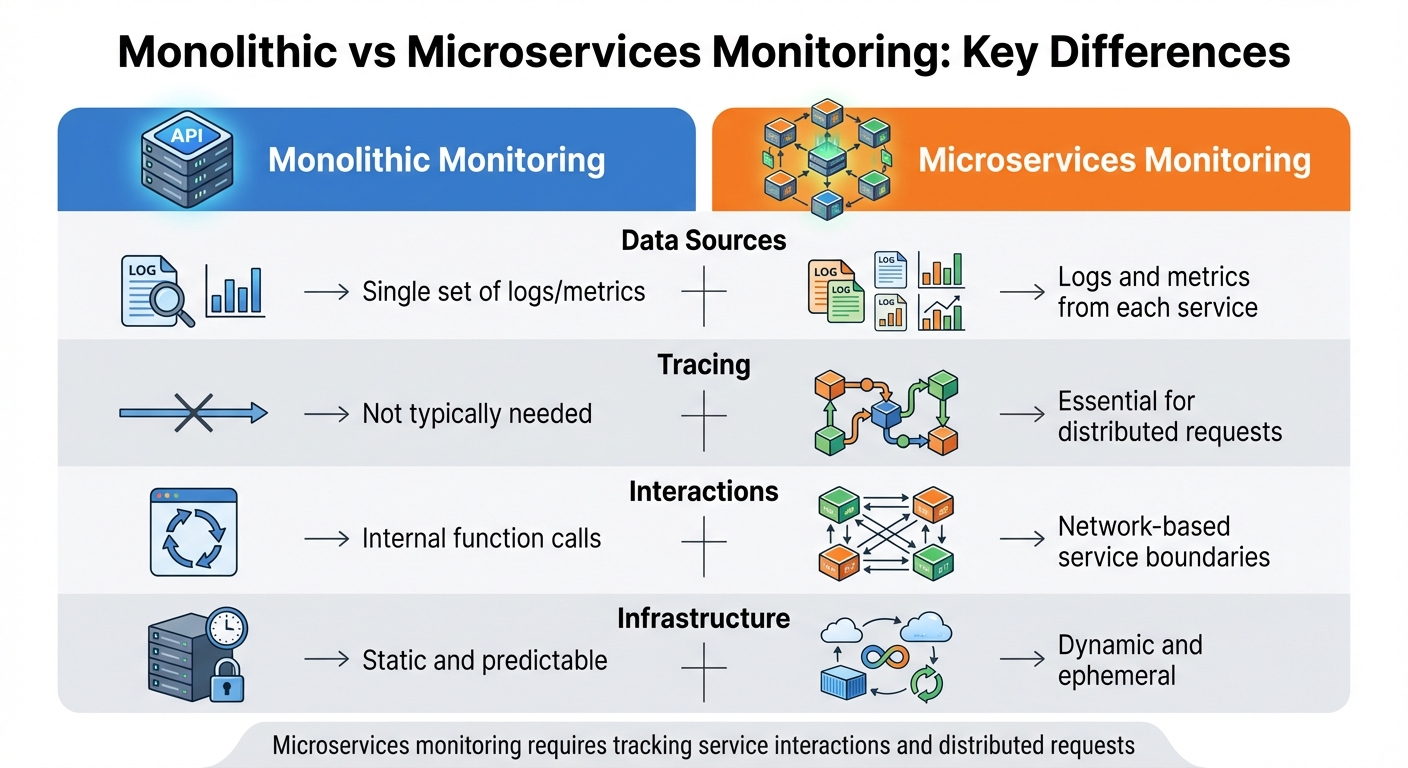
Monolithic vs Microservices Monitoring: Key Differences
Keeping tabs on microservices is a whole different ballgame compared to monitoring a single application. Instead of focusing on one codebase, you're managing an intricate web of independent services, all communicating across a network. Each service generates its own telemetry data, and a single user request might interact with ten or more services before completion. To make sense of this complexity, you need a structured approach. The following principles are essential for identifying and resolving performance issues in a microservices environment.
The Three Pillars of Monitoring
At the heart of effective microservices monitoring are three interconnected data types. Together, they provide a complete picture of your system's health and performance.
Metrics are numerical indicators that reveal the overall condition of your services. Think of CPU usage, memory consumption, request rates, and error counts. Metrics give you a high-level view and help trigger alerts when something seems off. They're designed to be lightweight. However, managing their scale can be tricky. For example, a single metric like disk availability across 10,000 nodes might generate around 100,000 time series, but adding high-cardinality labels like user IDs can push that number into the millions.
Logs are timestamped records that capture specific events, making them invaluable for diagnosing failures. When something goes wrong or a transaction is completed, logs provide details about what happened, when it happened, and the surrounding context. While metrics can tell you what failed, logs explain why it failed. This makes them critical for debugging and pinpointing root causes.
Distributed tracing maps the journey of a request as it moves across service boundaries. Each trace is made up of spans, which represent operations performed by different services. This is where microservices monitoring truly diverges from traditional methods. Trace context propagation, often using HTTP headers like the W3C traceparent header, allows monitoring tools to piece together the entire request path.
"Monitoring microservices is as much about understanding service interactions as it is about watching resource usage." - Icinga
These three pillars work best when integrated. Use unique Request IDs (or Trace IDs) to link metrics, logs, and traces across services. For instance, when a metric-based alert fires, you can trace the request flow and dive into logs for detailed error messages.
While these pillars offer powerful insights, the distributed nature of microservices also brings unique challenges.
Common Monitoring Challenges
Monitoring microservices comes with its own set of hurdles, requiring thoughtful strategies to overcome them.
Decoupled resources and network dependency add layers of complexity. Tools like Kubernetes and containerized environments abstract applications from physical resources, making it harder to pinpoint the root of performance issues. For example, a slowdown could involve a specific container, pod, or service. Additionally, what used to be simple in-process function calls are now network requests. A single user action might trigger dozens of internal API calls, introducing potential issues like network latency, packet loss, or connection failures .
Ephemeral infrastructure complicates monitoring further. Containers often have short lifespans, existing for just minutes or hours before being replaced during deployments or scaling events. Your monitoring system needs to differentiate between intentional scale-downs and actual crashes. Instead of tracking individual instances, focus on the health of entire service pools or clusters.
Data volume and fragmentation are inevitable in microservices environments. Instead of managing a single set of logs, you're now collecting data from every service. Each service generates its own metrics, logs, and traces, leading to massive volumes of fragmented data. The solution isn’t to collect less data but to use tools and strategies that effectively correlate and analyze it.
| Aspect | Monolithic Monitoring | Microservices Monitoring |
|---|---|---|
| Data Sources | Single set of logs/metrics | Logs and metrics from each service |
| Tracing | Not typically needed | Essential for distributed requests |
| Interactions | Internal function calls | Network-based service boundaries |
| Infrastructure | Static and predictable | Dynamic and ephemeral |
To navigate these challenges, focus on the Four Golden Signals that Site Reliability Engineering (SRE) teams emphasize: Latency (response times), Traffic (request volume), Errors (failure rates), and Saturation (resource utilization). Monitor these signals across every layer of your architecture, and set alerts based on Service Level Objectives (SLOs) that directly affect user experience rather than minor fluctuations.
Selecting Monitoring Tools
Choosing the right monitoring tools for microservices involves balancing technical needs with operational efficiency. A poor selection can lead to expensive licensing fees and increased management complexity.
Tool Selection Criteria
When selecting a monitoring tool, start by assessing its ability to correlate metrics, logs, and traces. This feature is essential for diagnosing issues across distributed systems. For example, when an alert is triggered, your tool should allow you to connect metric spikes with corresponding traces and logs seamlessly.
Distributed tracing is another must-have. It enables you to track a single request as it moves through multiple independent services, helping you pinpoint where delays or errors occur.
Scalability is equally important. In a microservices environment, each service generates its own telemetry, resulting in much larger data volumes compared to monolithic systems. Ensure your chosen tool can handle high-cardinality data effectively.
Integration flexibility is another key factor. Tools that support open standards like OpenTelemetry - which is backed by over 90 observability vendors - allow you to avoid vendor lock-in. This flexibility makes it easier to switch or combine tools as your needs evolve.
For dynamic setups, such as Kubernetes-based deployments, automation is crucial. Your monitoring tool should automatically detect and monitor new service instances without requiring manual configuration. Look for options with native support for tools like Operators, Helm charts, or DaemonSets.
Finally, consider your deployment preferences. Open-source stacks like Prometheus and Jaeger provide robust features without licensing costs but require more effort for integration and maintenance. On the other hand, SaaS platforms offer a streamlined, all-in-one experience with quick setup, though they may come with higher costs and the risk of vendor lock-in. OpenTelemetry-native tools strike a balance by offering unified metrics, logs, and traces while maintaining open-source flexibility.
These criteria can help you navigate the variety of tools available for metrics, logs, traces, and visualization.
Types of Monitoring Tools
Understanding the different categories of monitoring tools can further refine your selection process.
- Metrics monitoring tools: These track key performance indicators like latency, traffic, errors, and saturation. Prometheus is the go-to choice for metrics in cloud-native environments, while alternatives like StatsD and Icinga cater to other use cases.
- Logging tools: These centralize event logs from all your services. The ELK Stack (Elasticsearch, Logstash, Kibana) is widely used for its powerful search features, while Loki offers a simpler, cloud-native-friendly option. Fluentd serves as a versatile log collector that can route data to various destinations.
- Tracing tools: Tools like Jaeger and OpenTelemetry provide a visual map of request flows across services. OpenTelemetry has become the standard for instrumentation, offering a vendor-neutral framework to generate traces, metrics, and logs via a single SDK.
- Visualization platforms: Solutions like Grafana and Kibana turn telemetry data into actionable insights through customizable dashboards, charts, and graphs.
Emerging tools based on eBPF technology, like Grafana Beyla, are gaining traction for their ability to auto-instrument applications without requiring code changes. These tools are especially useful for legacy systems where modifying the source code is not an option.
When choosing tools, consider how you plan to instrument your applications. Manual SDK instrumentation provides detailed, custom metrics but requires code modifications. Auto-instrumentation agents, such as Java JVM agents, support multiple programming languages with minimal changes. eBPF-based tools, on the other hand, deliver standard infrastructure metrics without altering your application code.
Ultimately, your choice should align with your specific needs. A small startup with a handful of services will have different requirements than a large enterprise managing hundreds of microservices across multiple regions. Focus on tools that address your current challenges while offering room to scale as your microservices architecture grows.
Integration Steps
To integrate monitoring tools, you'll need to instrument your applications for telemetry data collection, configure distributed tracing, and automate service discovery as your environment grows.
Adding Metrics and Logging to Microservices
You can instrument your services for metrics and logs using three key methods: manual SDK instrumentation, agent-based auto-instrumentation, and eBPF-based tools.
- Manual SDK instrumentation: This approach uses OpenTelemetry SDKs, where you initialize a Tracer and Meter with a unique
scopeNameto identify the data source. While it gives you the most control over the data collected, it requires direct access to your codebase. - Agent-based auto-instrumentation: This method is faster for supported languages like Java and .NET. Without modifying your source code, you can collect telemetry by attaching agents at runtime. For instance, in Java applications, a JVM agent can capture traces, metrics, and logs directly from commonly used frameworks and libraries.
- eBPF-based tools: Tools like Grafana Beyla allow you to instrument applications in any language without altering the code. This is especially useful for legacy systems where code changes aren't an option.
Once your services are instrumented, set up a data pipeline to direct telemetry data - metrics, logs, and traces - to an OpenTelemetry Collector. The Collector processes and forwards the data to your chosen backend, whether that's Grafana Cloud, Loki, or another platform. While you can send data directly in OTLP format, routing through the Collector provides additional control over processing, filtering, and routing to multiple backends.
With metrics and logs in place, the next step is implementing distributed tracing to identify performance issues.
Implementing Distributed Tracing
Distributed tracing revolves around the concept of a span, which represents a single operation. To capture an operation's details, start a span at the beginning of a function and end it when the function completes. For example, in Go, you can use the defer pattern to ensure the span ends properly even if the function exits early or encounters an error: defer span.End().
Context propagation is essential for maintaining visibility across service boundaries. When one service calls another, pass the trace context using standard HTTP headers to link spans into a unified trace.
For Kubernetes environments, the OpenTelemetry Operator simplifies tracing by automatically injecting instrumentation into workloads. This removes the need for manual configuration in deployment manifests and ensures consistent tracing across all services.
Your OpenTelemetry Collector should include these components:
- OTLP Receiver: Collects traces, metrics, and logs in a standardized format.
- Kubernetes Attributes Processor: Automatically discovers pods and enriches telemetry with metadata like pod name, node name, and namespace.
- Exporters: Configured to send telemetry to your monitoring platform's endpoint.
By including resource attributes like host.value or pod.name, you can seamlessly navigate between traces, logs, and metrics during debugging.
Automating Service Discovery and Monitoring
With your telemetry pipeline in place, automating service discovery ensures that your monitoring adapts to dynamic environments like Kubernetes.
Deploy the OpenTelemetry Collector in two modes for comprehensive coverage:
- Daemonset: Runs on every node to collect telemetry data, including application-level traces, logs, and metrics, as well as node, pod, and container metrics.
- Deployment: A single replica gathers cluster-level metrics, such as pod phases, node conditions, and deployment statuses, without duplicating data.
| Component | Deployment Mode | Primary Function |
|---|---|---|
| OTLP Receiver | Daemonset | Collects application-level traces, metrics, and logs in OTLP format |
| Kubeletstats Receiver | Daemonset | Pulls node, pod, and container metrics from the local kubelet API |
| Filelog Receiver | Daemonset | Tails and parses Kubernetes logs from the host filesystem |
| Kubernetes Cluster Receiver | Deployment (1 replica) | Monitors cluster-wide state (node conditions, pod phases, deployment status) |
The Kubernetes Attributes Processor automatically handles service discovery. It monitors the Kubernetes API for new pods, extracts metadata, and attaches it to spans, metrics, and logs. This allows your monitoring platform to group telemetry by service name or namespace without requiring manual tagging.
Using the OpenTelemetry Collector Helm chart, you can enable features like pod discovery, node tracking, and cluster health monitoring. Update your values.yaml file as follows:
- Enable
kubernetesAttributes: enabled: truefor automatic pod discovery. - Enable
kubeletMetrics: enabled: truefor tracking node and container metrics. - Enable
clusterMetrics: enabled: truefor monitoring cluster health. - Configure an OTLP exporter with your monitoring platform's endpoint in the
config.exporterssection.
The Filelog Receiver simplifies log collection by automatically tailing Kubernetes log files located at /var/log/pods/*/*/*.log. It extracts metadata from the file names, ensuring logs from new pods are captured immediately without requiring manual setup.
Monitoring Best Practices
With telemetry now in place, it's essential to implement monitoring practices that keep your systems running smoothly. This involves focusing on health checks, configuring alerts effectively, and continuously refining your setup.
Setting Up Health Checks and Alerts
To ensure your system operates as expected, set up /health and /ready endpoints. These endpoints allow load balancers to direct traffic only to instances that are fully operational. The health endpoint confirms that essential processes are running and internal dependencies are functional, while the readiness probe ensures the service can handle incoming requests without delays.
When configuring alerts, base them on Service Level Objectives (SLOs) aligned with the Four Golden Signals (latency, traffic, errors, and saturation). This approach reduces unnecessary noise and helps resolve issues faster. Avoid triggering alerts for temporary resource spikes; instead, focus on user-impact metrics and error budget consumption. For example, you can use a multi-window strategy: set alerts to trigger if the 5-minute burn rate exceeds 14 and the 1-hour burn rate exceeds 1, or if only 20% of your error budget remains. If an alert doesn’t require action, it’s just adding to the noise - refine or remove it.
"Focus on SLOs and Alerts that Matter. Don't alert on every CPU spike. Define Service Level Objectives (SLOs) for what matters to your users... Alert on your error budget burn rate - this reduces alert fatigue and focuses your team on issues that impact users." - Yuvraj Singh Jadon, Author, SigNoz
To streamline troubleshooting, link metrics, logs, and traces using unique request IDs. This integration speeds up root-cause analysis when alerts are triggered.
Maintenance and Optimization
Once your telemetry pipeline is established, it’s crucial to keep refining your monitoring setup as your system evolves. Review alert thresholds and metrics every quarter to ensure they focus on user-impacting issues rather than minor infrastructure events.
Be mindful of resource usage by limiting unique label combinations. Keep metric cardinality below 10 whenever possible, and avoid using high-cardinality labels like user_id, as they can generate millions of time series. For instance, 10,000 nodes exposing 10 filesystem metrics result in 100,000 time series, which is manageable. However, adding per-user quotas could escalate this into the millions, creating unnecessary strain.
Standardize instrumentation across teams with OpenTelemetry semantic conventions (e.g., service.name, http.status_code) to maintain consistency. Use tail sampling in high-traffic systems to capture 100% of error or slow traces while sampling healthy requests to manage storage costs. Export default values like "0" for missing metrics to avoid breaking dashboard calculations.
To prevent tool sprawl, regularly review your monitoring stack to ensure it remains cohesive and scalable as your architecture grows. Instrument telemetry early in the development process rather than after deployment, and make sure crash data from pods is exported to persistent storage immediately to avoid losing valuable telemetry during failures.
Conclusion
Incorporating monitoring tools into your microservices architecture is important for maintaining a clear view of your distributed systems. As Icinga aptly puts it, "Monitoring microservices is as much about understanding service interactions as it is about watching resource usage". Without proper instrumentation, you risk losing sight of how your interconnected services operate, making it harder to identify and resolve issues effectively.
Good monitoring goes beyond just collecting data - it connects metrics, logs, and traces to deliver actionable insights quickly. By focusing on the Golden Signals - latency, traffic, errors, and saturation - you can zero in on what directly impacts your users, ensuring you address the most pressing concerns.
To embed monitoring into your development process, start by setting clear Service Level Objectives (SLOs) and leveraging unique request IDs to track user journeys. The resource overhead is minimal - for example, incrementing a Java counter takes just 12-17 nanoseconds - but the operational benefits are immense. Early instrumentation lays the groundwork for a resilient system from the outset.
As you refine your approach, consider standardizing your instrumentation with OpenTelemetry, safeguarding your monitoring credentials, and fine-tuning alert thresholds. This ensures your system focuses on user-impacting issues rather than unnecessary noise.
Monitoring microservices requires a shift in mindset: it’s no longer about watching individual servers but understanding the intricate web of service interactions and dependencies. By implementing these robust monitoring practices now, you set the stage for long-term resilience and adaptability in your microservices architecture.
FAQs
What makes distributed tracing different from traditional monitoring?
Distributed tracing offers a clear, detailed picture of how a single request travels through various microservices, highlighting per-request latency and illustrating the interactions between services. This makes it easier to identify where delays or failures occur in complex systems.
On the other hand, traditional monitoring emphasizes aggregated metrics such as CPU usage, memory consumption, or overall service performance. However, it doesn't tie this data to individual requests. While both approaches play important roles, distributed tracing is important for unraveling the behavior of requests within a microservices setup.
What should I look for in a monitoring tool for microservices?
When picking a monitoring tool for microservices, it's crucial to choose one that offers clear visibility into your entire system. Prioritize tools that cover the three pillars of observability - metrics, logs, and traces. These are essential for keeping an eye on service health and understanding how different components interact. The ability to correlate data across services is also a must, as it helps you quickly pinpoint and resolve issues.
Some key factors to keep in mind include scalability - ensuring the tool can manage heavy traffic without slowing things down - and flexibility, with support for on-premises, cloud, or hybrid setups. Features like customizable alerts, intuitive dashboards, and secure access controls (such as role-based permissions) are also critical for smooth operations.
If you're using DreamFactory to create secure secure REST APIs via data access platforms from your databases, it's smart to pick a monitoring tool that integrates directly with your API endpoints. This will give you a complete view of both your data layer and the microservices that rely on it, simplifying integration and making it easier to monitor your entire system.