
Over the years the DreamFactory team has collaborated on a lot of really interesting API-oriented projects. Many of these projects involve integrating the DreamFactory platform into a much larger technology ecosystem. To put this into perspective, although our client base ranges widely in terms of both industry and company size, we often work with organizations tending towards the larger end of the scale. Among others we're presently working with one of the world's largest auto manufacturers, one of the world's largest pharmaceutical companies, one of the world's largest consulting companies, and one of the world's largest computer hardware manufacturers. As you might imagine, big companies means big API problems.
Yet our most interesting project to date didn't involve a member of the Fortune 100; rather, the client is a relative upstart named Decision Desk HQ. Founded in 2012 with the goal of improving the speed in which US election data is reported and in which elections are called, the staff has since grown from its founder to hundreds of employees and volunteers located around the United States. Decision Desk HQ's status as an election reporting juggernaut grew dramatically in the recent US election due to their calling the presidential election for Joe Biden a full 48 hours before competing operations across the media and major television networks. This feat was accomplished in part because of Decision Desk HQ's forward-thinking views on technology allows them to gather, process, and distribute election results in a very performant and efficient manner.
We're excited to announce DreamFactory's role in Decision Desk HQ's election reporting operations. Our infrastructure provided API services which assisted in the processing of nearly 3 billion requests and 4 terabytes of data over a 72 hour period beginning with the start of election reporting at 6pm Eastern on November 3rd. In this post I'll summarize the different ways in which the APIs were used, the amount of data processed, and how API infrastructure was monitored to ensure smooth operation throughout the election.
Data in Multiple Formats
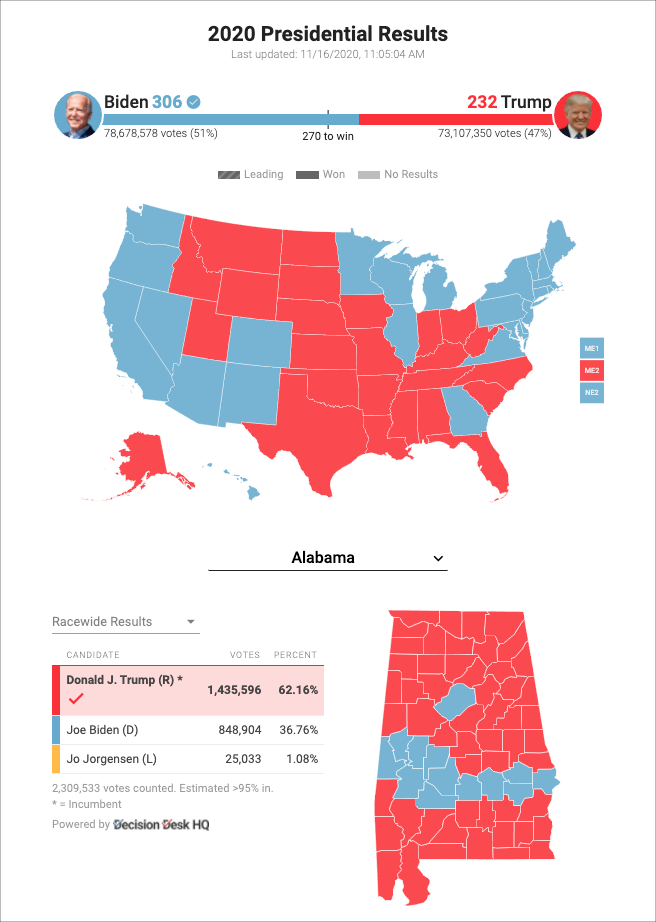
Decision Desk HQ clients include numerous media outlets such as Vox, Business Insider, and The Economist. These clients used the data in a variety of ways. Some query the API directly, retrieving information about the status of the presidential election, specific congressional races, or even the status of all races occurring within a specific state. Others take advantage of "embeds", which are slick infographics produced by Decision Desk HQ and which can be, well, embedded into client websites. For instance the following embed screenshot was taken from Vox' live election results page:
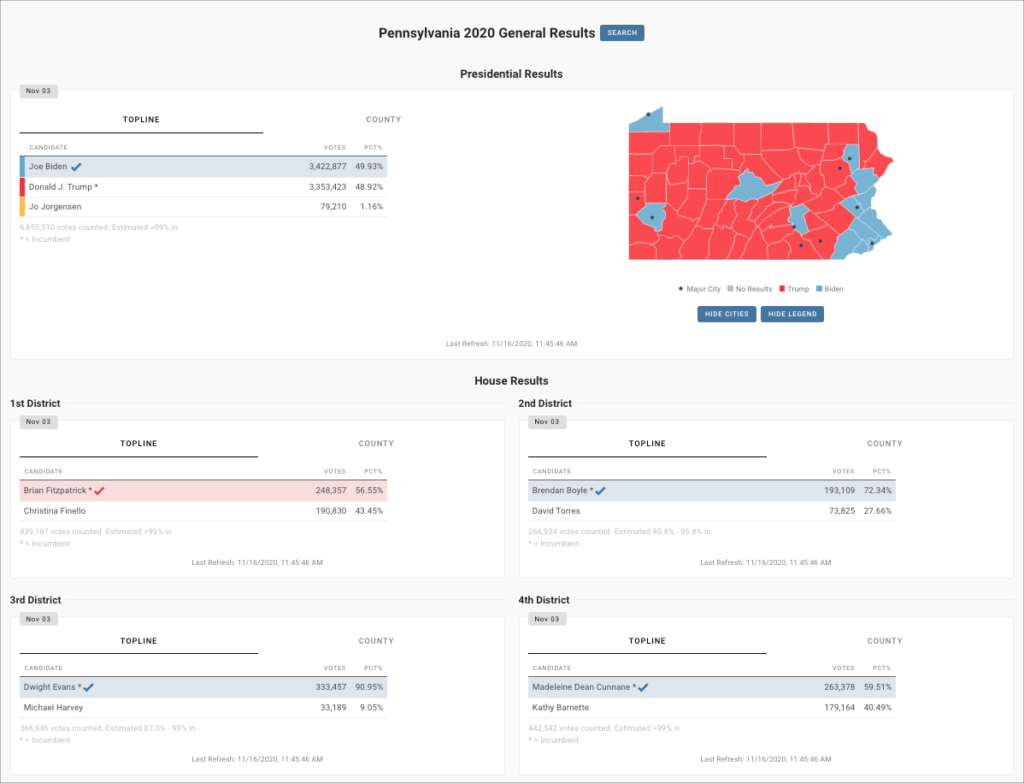
Decision Desk HQ also publishes a public set of interactive infographics at https://results.decisiondeskhq.com/ which not only breaks down national results but also state results. For instance here is a screenshot of the Pennsylvania coverage breakdown:
All Politics is Local, But Interest is Global
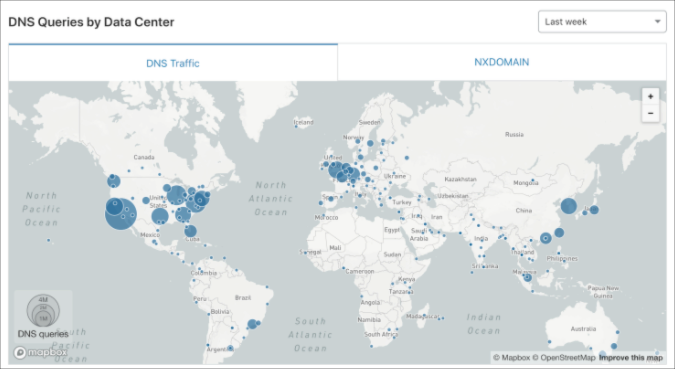
There's a saying in US politics, "all politics is local". However given the United States' outsized influence on global matters, US elections are of significant interest around the world as evidenced by this image which breaks down Decision Desk HQ DNS queries by data center:
As mentioned, during this three day period almost 3 billion requests and 4 terabytes of data were processed:
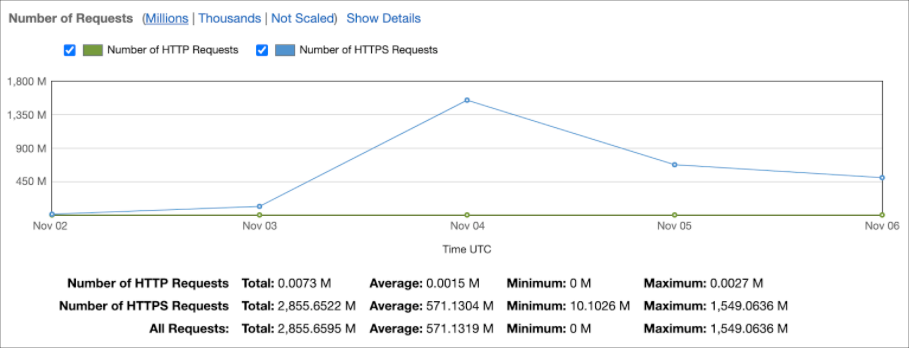
Of course given such load, a lot of the requested data was heavily cached at various levels, including the CDN, the API infrastructure's caching layer, and other mechanisms.
System Monitoring's Crucial Role
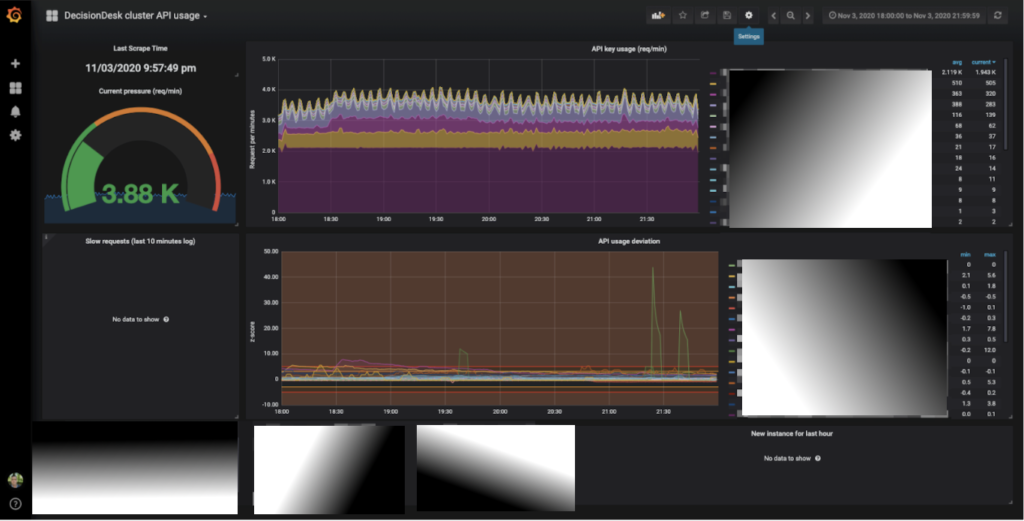
It probably won't come as a surprise that given the amount of traffic, we wanted to built out a robust monitoring and alerting solution. For systems and service monitoring we used Prometheus, and created a number of custom Grafana dashboards which were displayed Norad-style in our (home) offices. One of my favorite is a real-time API key volume monitor, which displayed up-to-the-minute summary of request volume on a per-API key basis. It also charts API key usage deviation, letting us know if a client's system was potentially misconfigured should an unusual surge of traffic suddenly show up.
As you can see, several portions of this are heavily redacted, however it's really cool I swear!
In addition to Prometheus, both teams made extensive use of numerous third-party monitoring tools, even redundantly so, employing services like Rollbar, OhDear, StatusCake, and server density to monitor various aspects of the infrastructure.
Conclusion
From a technical perspective, election reporting presents several fairly unique challenges in that not only must data be reliably drawn from thousands of resources, but it must also be distributed securely and performantly in a manner which can be flexibly consumed by an audience of millions. Our hats are off to the Decision Desk HQ team for their ability to handle a project of such scale, and we are proud of the opportunity to have participated in this project.