Introducing DreamFactory's Event-Driven Log Service
In DreamFactory 2.3.1 we introduced the Log service supporting Logstash, which allows you to send any log messages to a Logstash service, utilize the power of ELK stack, and get REST API usage data using visual tools like Kibana. However, there was one limitation: the DreamFactory Logstash service wasn't smart enough to do anything on its own.
In 2.3.1 you have to use the log service explicitly either from your client application or by using DreamFactory's scripting system to send any log messages to Logstash (logging scripts need to be added to every pre/post process event you need to log). This adds unnecessary complexity and becomes a maintenance headache.
To resolve this issue, we made the Logstash service a bit smarter in DreamFactory 2.4.2 by adding the ability to tie the Logstash service to any number of events generated by the DreamFactory platform. The service still functions the way it does in 2.3.1. Now, though, when you tie the logging service to one or more events, DreamFactory automatically captures and sends logs to Logstash as those events get fired, without any additional scripting.
In addition to making the service event-driven, we also added the option for you to pick the log context that gets reported with your log message. Log contexts are data objects like Request, Response, platform information, and so forth. This additional system information gets reported with your log message so so you have helpful context (i.e., system state) of your log message.
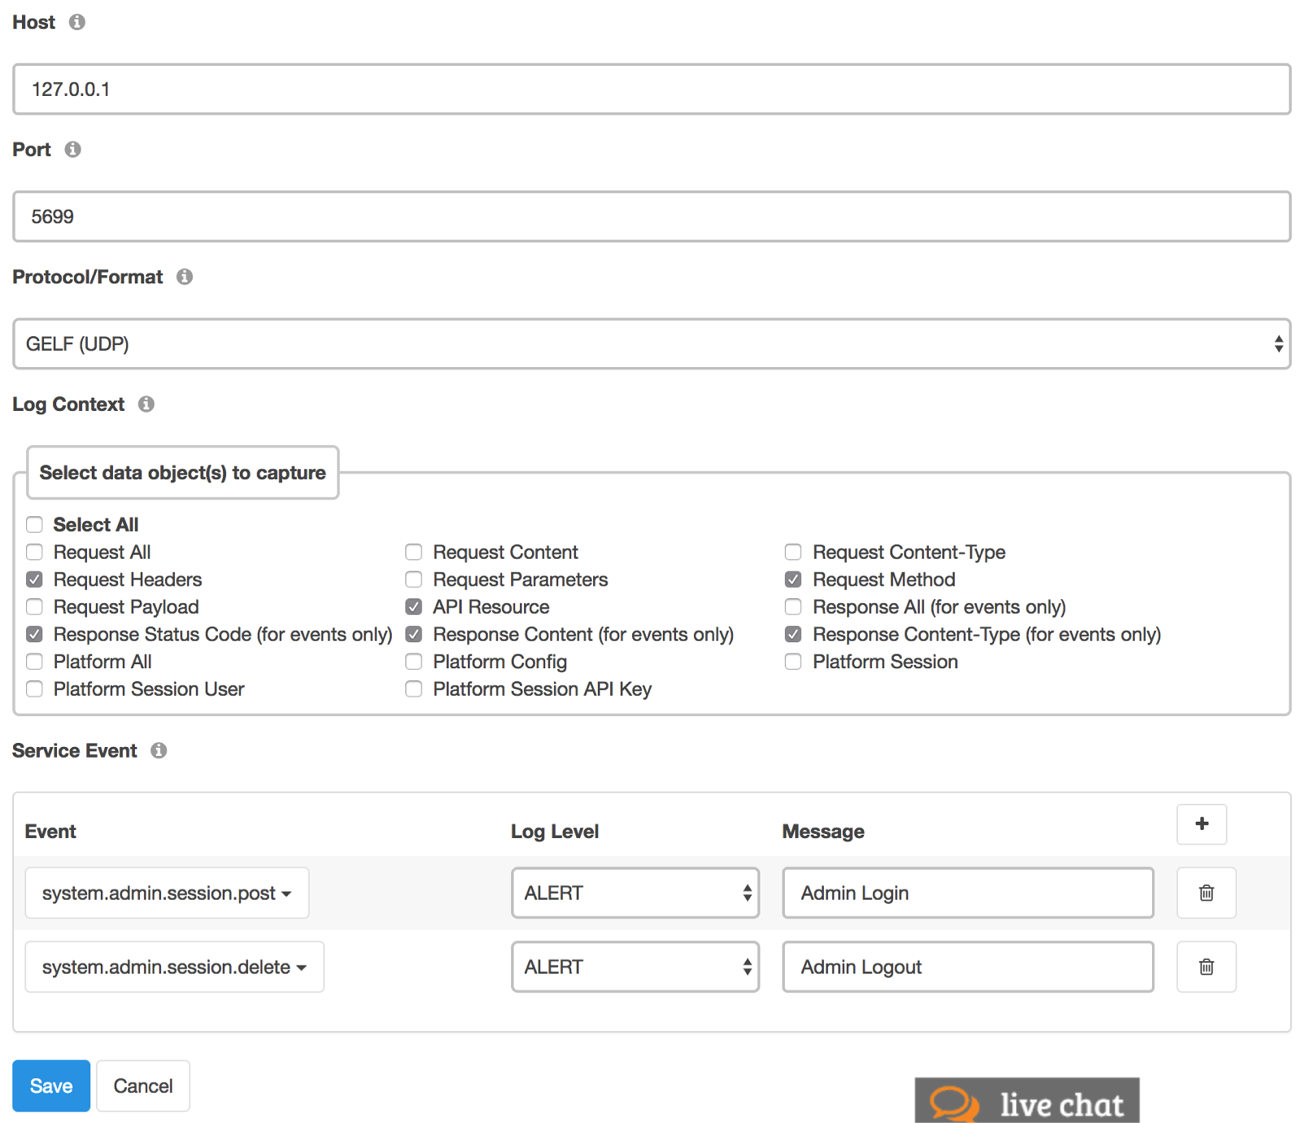
Here is a screenshot of the new Logstash configuration page. It shows all the options for Log Context and the UI area where you can tie your service with system events.

The Log Context options are pretty self-explanatory. One thing to note here is that Response data is only applicable for events. This is why you see the text “for events only” in parenthesis next to them. All other log context still applies when you use this service explicitly.
In the Service Event section, you can tie this service to any number of system events. In this screenshot, we have tied our service with two events - “system.admin.session.post” and “system.admin.session.delete”. These events are fired to Logstash when a system admin logs in and logs out of DreamFactory. In this example, we've also selected our Log level and Message for these events. Log Level and Message are optional. If you leave them blank then the default log level is INFO and default message is the full name of the event. If you choose GELF (UDP) for your service protocol/format then log level is going to be the standard numeric value of GELF syslog. For all other protocols (HTTP, TCP, UDP) the log level is the standard numeric value of Monolog.
| GELF Syslog |
Monolog |
||
| Level |
Numeric value |
Level |
Numeric value |
| EMERGENCY |
0 |
EMERGENCY |
600 |
| ALERT |
1 |
ALERT |
550 |
| CRITICAL |
2 |
CRITICAL |
500 |
| ERROR |
3 |
ERROR |
400 |
| WARNING |
4 |
WARNING |
300 |
| NOTICE |
5 |
NOTICE |
250 |
| INFO |
6 |
INFO |
200 |
| DEBUG |
7 |
DEBUG |
100 |
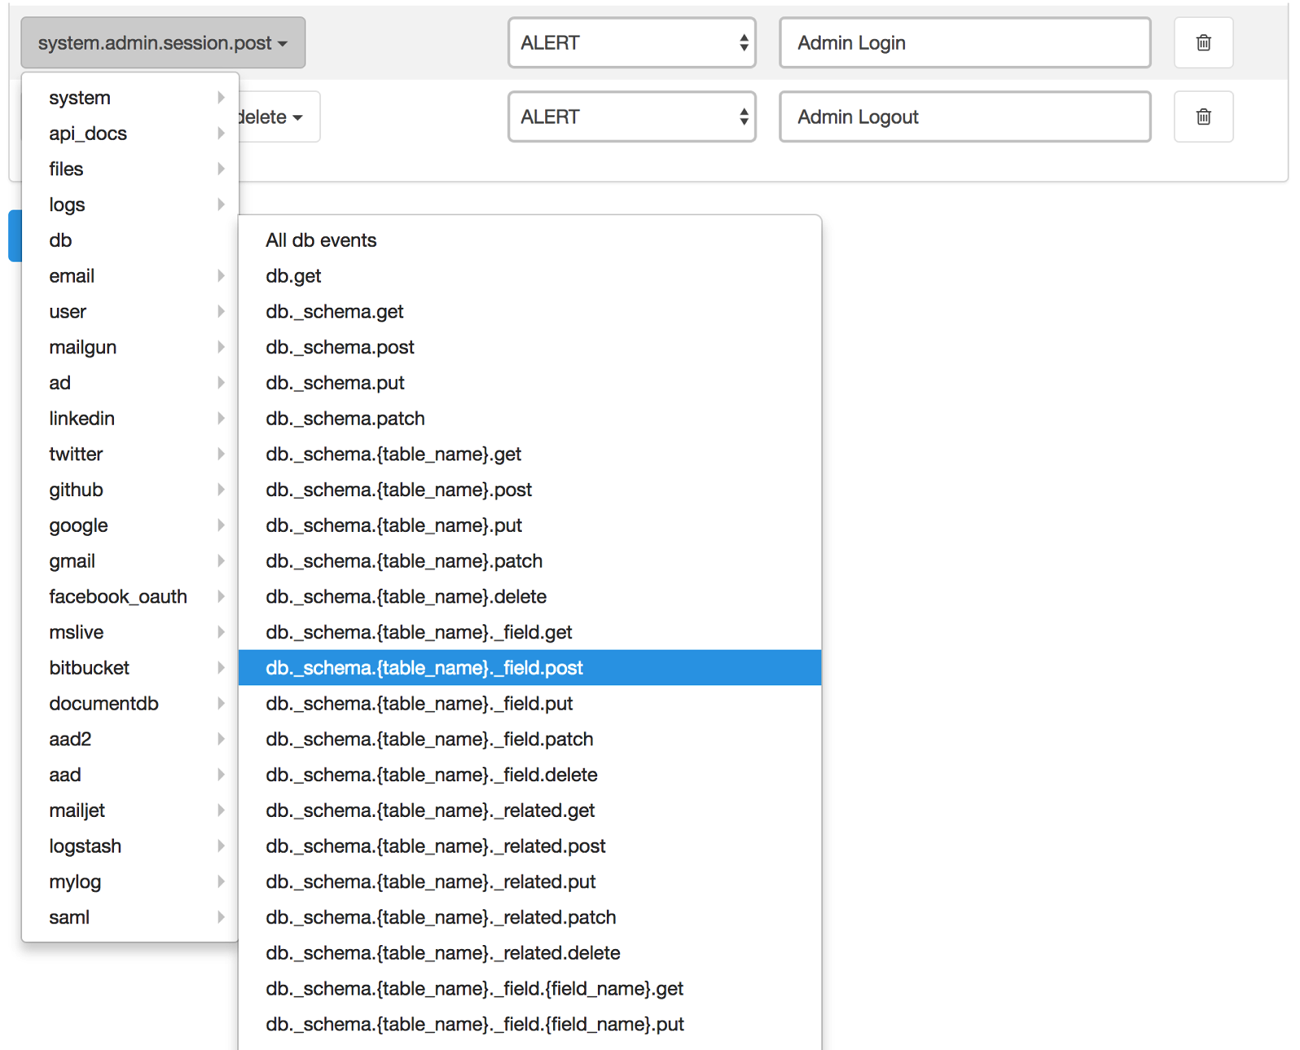
The event drop down menu lets you select from all available events from your DreamFactory services. Here's a screenshot partially showing the event drop down selector.

Logging your REST API calls in DreamFactory is easier than ever. Head on over to the community forum to discuss or let us know what you think in the comments!
Kevin McGahey is an accomplished solutions engineer and product lead with expertise in API generation, microservices, and legacy system modernization, as demonstrated by his successful track record of facilitating the modernization of legacy databases for numerous public sector organizations.


 Blog
Blog
