
Observability is the key to understanding and improving MCP servers. These servers connect AI agents to tools, but without visibility, issues like slow responses, errors, or security risks can go undetected. Observability helps track how agents interact with tools, pinpoint failures, and optimize performance.
Key Takeaways:
- What to Monitor: Focus on three layers - Transport/Protocol (e.g., JSON-RPC health), Tool Execution (e.g., latency, errors), and Agentic Performance (e.g., task success rates).
- Metrics That Matter: Track handshake success rates, tool execution latency, token usage, and tool hallucination rates (2%-8% in mature systems).
- Why It’s Important: Observability improves reliability, identifies security risks (e.g., 60% of incidents involve unexpected access), and helps allocate resources effectively (20% of tools handle 80% of requests).
- Real-Time Insights: Use P95/P99 latency and anomaly detection to catch issues early, like retry loops or unexpected spikes.
- Logging Best Practices: Use structured JSON logs with trace IDs, span IDs, and metadata for detailed audit trails while avoiding sensitive data exposure.
- Tools for Observability: Prometheus and Grafana provide metrics visualization, while platforms like DreamFactory enhance logging, monitoring, and security.
Observability transforms MCP servers from opaque systems into manageable, measurable components, ensuring better performance, security, and scalability.
Top 5 MCP Servers for Observability | Prometheus, Grafana, Tempo & Loki
Core Observability Metrics for MCP Servers
Three-Layer MCP Server Observability Metrics Framework
Key Metrics to Track
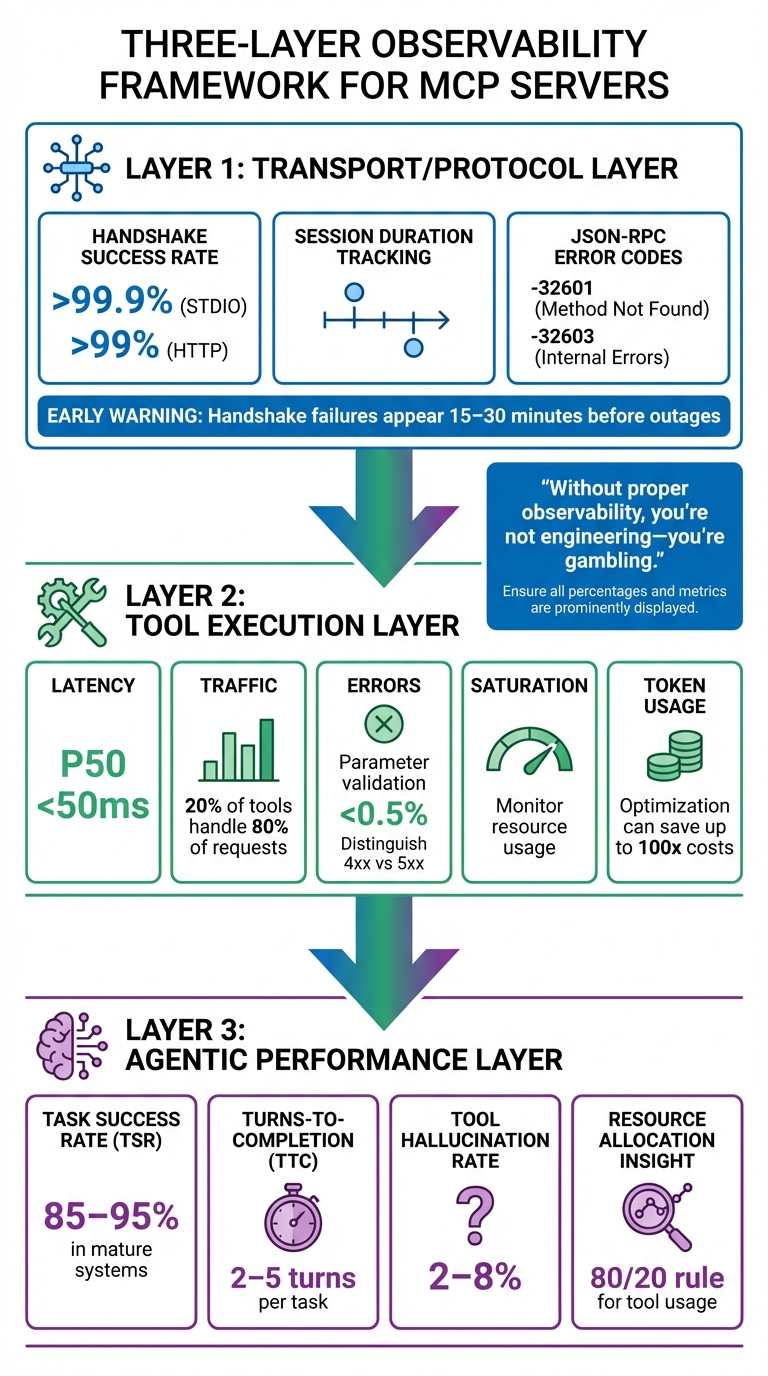
Monitoring MCP servers effectively means keeping an eye on metrics across three critical layers: the Transport/Protocol Layer, the Tool Execution Layer, and the Agentic Performance Layer. Each layer plays a unique role in ensuring the system operates smoothly and achieves user goals.
At the Transport Layer, focus on metrics like Handshake Success Rate, Session Duration, and JSON-RPC error codes. Handshake success rates should exceed 99.9% for STDIO and 99% for HTTP. Specific error codes like -32601 (method not found) and -32603 (internal errors) are red flags, often signaling broader system issues. Notably, handshake failures can serve as an early warning, typically appearing 15 to 30 minutes before a full system outage.
The Tool Execution Layer requires monitoring the SRE "Golden Signals": Latency, Traffic, Errors (distinguishing between 4xx and 5xx), and Saturation. For example, execution latency at the 50th percentile should stay under 50ms, and parameter validation errors should remain below 0.5%. Token usage is another key metric here, as refining prompts can lead to massive cost reductions - teams have reported savings of up to 100x.
Finally, the Agentic Performance Layer focuses on the AI's ability to meet user needs. Metrics like Task Success Rate (TSR) are crucial, with mature systems typically achieving rates between 85% and 95%. Other important metrics include Turns-to-Completion (TTC), which should ideally range from 2 to 5 turns per task, and Tool Hallucination Rate, which generally falls between 2% and 8%. It's worth noting that 20% of tools often handle 80% of all requests, so identifying these high-traffic tools can help allocate resources more effectively.
"Without proper observability, you're not engineering - you're gambling. And in production environments handling thousands of requests per second, that gambling can cost companies tens of thousands of dollars per hour." - Yiğit Konur, Zeo
These metrics are essential for identifying and addressing issues before they escalate, ensuring the reliability and efficiency of MCP operations.
Why Real-Time Metrics Matter
Tracking core metrics is only part of the equation. Real-time monitoring takes it further by turning raw data into actionable insights. Unlike traditional APIs with fixed endpoints, LLMs dynamically select MCP tools at runtime. This unpredictability makes real-time monitoring a necessity. For example, AI agents can enter retry loops, causing a sudden spike in call volumes. Without real-time tracking, these anomalies could go unnoticed until they lead to skyrocketing API costs.
Real-time data also changes how you respond to issues. Imagine a tool’s latency jumping from 200ms to 10 seconds - instant insights allow you to identify the root cause, whether it’s a slow query or memory pressure. Many production MCP servers implement memory usage alerts when heap utilization exceeds 85%, helping prevent crashes during periods of high demand.
To catch issues affecting the "unlucky 1%" of users, set alerts based on P95 and P99 latency percentiles rather than averages. For instance, configure alerts if a search_docs tool exceeds 1,000ms for more than 5 minutes. Real-time observability also helps detect security threats, such as unauthorized access attempts or data scraping by malicious agents. Given the unpredictable nature of AI-driven interactions, intelligent anomaly detection is crucial to avoid drowning in irrelevant alerts.
Logging Strategies for MCP Servers
When it comes to MCP servers, effective logging bridges the gap between operational data and actionable insights. It's not just about collecting data; it's about making that data meaningful and usable.
Core Logging Requirements
To be effective, MCP server logging should follow a few key principles:
- Standardized Levels: Logs should conform to RFC 5424 severity levels, including debug, info, notice, warning, error, critical, alert, and emergency.
- Structured Format: Use machine-readable formats like JSON to simplify automated analysis and integration with monitoring tools.
- Traceability: Every log entry needs unique identifiers like Trace IDs and Span IDs. These help connect logs to OpenTelemetry traces, making it easier to troubleshoot issues.
- Comprehensive Metadata: Include relevant details like session IDs, user IDs, tool names, input arguments, and output data. This creates an audit trail that tracks agent activity.
- Security: Logs must avoid sensitive information like credentials, secrets, or PII. Use sanitization tools or regex to scrub sensitive data, and apply rate limiting to handle high-volume periods without overwhelming the system.
"MCP server logs play a critical role in preserving your agent's health." - Jon Gitlin, Senior Content Marketing Manager, Merge
How to Structure Logs for Audit and Analysis
Well-structured logs turn raw data into actionable insights. Here’s how you can achieve that:
- Correlation IDs and Trace IDs: These link event chains across servers and sessions, essential for auditing complex AI agent interactions.
- Hierarchical Span Models: Use OpenTelemetry-based spans to organize logs. For example, a root "session" span can include "task" spans, which further break down into "turn", "agent.reasoning", and "tool.call" spans.
- Detailed Metadata: Include identifiers like User IDs, Tool IDs, Session IDs, and Request IDs. Add protocol-level details like JSON-RPC method names, response codes (e.g., -32601 for "Method not found"), and serialization latency.
- Performance Metrics: Log execution times (in milliseconds), token usage per tool call, and associated costs to monitor resource efficiency and pinpoint bottlenecks.
- Standardized Formats: Automatically redact sensitive fields like "authorization" for security. For console logging, use prefixes such as
[INFO],[DEBUG], and[ERROR]to make real-time streams easier to filter. - Internal Context: Capture the agent's reasoning steps to provide valuable context for debugging.
By following these practices, you create logs that are not only detailed but also easy to analyze. DreamFactory’s logging solutions offer a great example of how structured logging can enhance auditability.
DreamFactory's Logging Capabilities
DreamFactory takes logging to the next level with its secure, self-hosted enterprise data access platform. Every API call, data access request, and system event is logged with full context, creating a detailed audit trail for compliance and security monitoring.
One standout feature is identity passthrough, which ensures logs reflect real user identities instead of generic service accounts. This provides a clear view of who accessed what data and when. DreamFactory also integrates seamlessly with authentication systems like OAuth 2.0, LDAP/AD, and SAML/SSO, ensuring that all logged events include proper user context.
The platform captures metadata such as timestamps, user identities, accessed resources, and response codes. This level of detail supports security investigations and helps meet regulatory requirements.
For MCP server setups, DreamFactory’s built-in capabilities allow you to use these logging features when AI agents access enterprise data. It also integrates with tools like Prometheus and Grafana, enabling you to connect log data with real-time metrics. This combination of structured logs and observability tools helps you trace metric anomalies back to their root causes, offering a complete picture of system health and performance.
Metrics and Monitoring with Prometheus and Grafana
Prometheus and Grafana are powerful tools for turning raw MCP data into actionable insights. Accurate metrics and real-time visualizations are essential for decoding MCP server performance and addressing issues swiftly. While Prometheus handles time-series data collection and storage, Grafana transforms this data into visual dashboards, making it easier to spot performance problems.
Setting Up Prometheus for MCP Monitoring
Monitoring MCP servers presents unique challenges. Unlike traditional REST APIs with multiple endpoints, MCP servers rely on a single gateway endpoint, such as /mcp. As Gato_Malo explains:
"MCP servers typically expose only a single gateway endpoint... making it impossible to distinguish which specific tool was called using standard API monitoring techniques".
To track individual tool performance, custom instrumentation is necessary. This can be achieved through methods like:
- Manual Wrappers: Use decorators or middleware to intercept and track tool calls.
- Monkey Patching: Replace the
McpServer.prototype.toolmethod at runtime to automatically wrap all registered tools. - Auto-Instrumentation: Use libraries such as OpenLIT, which require minimal setup (e.g., a simple
openlit.init()call).
"Monkey patching is sometimes frowned upon, but in this case, it allowed me to add tracing to all tool calls without individual instrumentation".
For Prometheus to scrape metrics, the server must expose a /metrics endpoint. This requires an auxiliary HTTP server running on a dedicated port, such as 9090 or 8000. Metrics must follow Prometheus's text-based format, such as:
mcp_tool_invocations_total{tool="query_db",status="success"} 1542
Here are some key metrics to track:
| Metric Name | Type | Description | Essential Labels |
|---|---|---|---|
mcp_tool_invocations_total |
Counter | Total count of tool calls | tool, status |
mcp_tool_duration_seconds |
Histogram | Latency of tool execution | tool |
mcp_active_connections |
Gauge | Number of concurrent SSE sessions | N/A |
mcp_tool_errors_total |
Counter | Count of failed tool executions | tool, error_type |
mcp_message_size_bytes |
Histogram | Size of incoming/outgoing messages | direction, type |
Using a centralized registry pattern simplifies the management of tool-specific metrics. This approach allows you to add new tools dynamically without altering core monitoring logic. Make sure to include labels like tool, status, and error_type for detailed filtering in Grafana. Additionally, redact sensitive information such as password, secret, and token when logging or recording metrics.
For long-lived connections, implement a "Connection Reaper" to close stale connections that remain idle for over an hour (3,600 seconds). Once Prometheus gathers these granular metrics, Grafana can visualize trends and highlight issues.
Building Dashboards with Grafana
Grafana transforms Prometheus metrics into intuitive dashboards, enabling quick detection of anomalies.
Since MCP servers operate through a single gateway endpoint, dashboards must rely on custom labels to differentiate between tool calls rather than monitoring aggregate traffic. Focus on latency percentiles, such as the 95th and 99th (P95/P99), instead of average response times. These metrics are more effective at identifying slow tool responses that disrupt user experiences. As Grizzly Peak Software notes:
"An MCP server without observability is a black box. When a tool invocation takes 10 seconds instead of the usual 200 milliseconds, you need to know why".
Organize dashboards into three main categories:
- Performance & Reliability: Metrics like latency and throughput.
- Resource Efficiency: CPU usage, memory consumption, and disk I/O.
- Application-Specific Quality: Tool usage patterns and session durations.
For long-running connections typical of MCP, monitor session stability, connection durations, and protocol handshake performance. Additionally, track context window usage, memory demands, and data access patterns to optimize server resources and prevent over-provisioning.
Dashboards should visualize both trends and anomalies, complementing baseline metrics established during initial setup. This helps identify deviations or regressions when changes are introduced. Configure alerts for metrics that exceed predefined thresholds, and use anomaly detection to minimize "alert fatigue".
Research shows that enabling more than 16 tools on an MCP server can significantly degrade response time and accuracy. For optimal performance and dashboard clarity, start with one to five essential tools. These dashboards are critical for maintaining the performance and reliability of MCP servers.
Using DreamFactory for Better Observability
DreamFactory adds another layer of observability by integrating seamlessly with Prometheus and Grafana. Its Docker-based deployment creates a pre-configured environment where Prometheus collects metrics and Grafana visualizes them.
Kevin McGahey, Product Lead at DreamFactory, highlights this integration:
"A no code API tool and a no code data visualization tool, it can't get much better than this".
DreamFactory monitors the entire stack, from the Docker host to individual containers and the monitoring services themselves. This includes Prometheus ingestion rates and scrape durations. The platform also offers built-in features like rate limiting, caching, and observability endpoints, which integrate directly with Prometheus and Grafana. Metrics tracked include CPU usage (by mode, such as guest or idle) and memory distribution (used, free, buffers, cached).
A standard DreamFactory Docker deployment typically includes about 10 containers to support both the API and monitoring infrastructure. The platform simplifies the transition from raw data collection in Prometheus to visual analysis in Grafana, offering a "no-code" approach to dashboard creation. This makes it easy to highlight critical metrics like request rates, latency distributions, and error counts - key indicators of MCP server health.
DreamFactory's identity passthrough ensures metrics reflect real user identities rather than generic service accounts, providing a clearer view of who accessed specific data and when. This level of observability is invaluable for maintaining robust server performance.
Security and Compliance in Observability
In MCP server design, observability plays a critical role in both boosting performance and ensuring secure operations. By making every action traceable and auditable, observability helps prevent security threats and compliance violations.
Tracking Security Events
MCP servers face distinct security threats that traditional monitoring tools often fail to address. For instance, tracking authentication events is vital. This includes logging details like user identity, client metadata, timestamps, IP addresses, geographic locations, and multi-factor authentication status. Such tracking allows for the detection of failed login attempts and unusual access patterns.
Real-time payload inspection is another essential layer of defense. It identifies anomalies like spikes in JSON-RPC "Method not found" (-32601) errors, which could indicate tool misbehavior or vulnerability probing. Research shows that 60% of security incidents in MCP systems involve unexpected resource access patterns.
Data Loss Prevention (DLP) measures further enhance security by scanning tool inputs and outputs in real time. This helps detect and prevent the leakage of sensitive information such as PII, API keys, or credentials. As MintMCP highlights:
"A single tool call can query customer databases, export results to external systems, trigger business workflows, or access regulated data across multiple jurisdictions. Without comprehensive logging, these actions remain invisible to security teams."
A multi-layered approach works best, combining strong ingress security (e.g., JWT/OAuth), tool-level policy enforcement, and continuous observability. Monitoring metrics like p99 latency can help predict resource exhaustion, while dedicated health endpoints (/health, /ready, /metrics) ensure the server is functioning securely.
Comprehensive event tracking not only enhances security but also supports the detailed audit trails required for compliance.
Maintaining Audit Trails for Compliance
Compliance frameworks demand tamper-proof audit trails with specific retention periods. These trails must meet the unique requirements of various regulations:
| Framework | Primary Focus | Key Requirement | Retention Period |
|---|---|---|---|
| HIPAA | Healthcare (PHI) | Track PHI access in detail | 6 Years |
| SOX | Financial Reporting | Maintain custody of financial data | 7 Years |
| PCI-DSS | Payment Card Data | Log all access to cardholder data | 1 Year |
| SOC 2 | Security & Availability | Log system access events | 1 Year Minimum |
| GDPR | Privacy & Consent | Ensure transparency in automated decisions | Purpose-specific |
Structured logging in JSON format is essential for compliance. Each log entry should capture the agent identity, tool invoked, parameters (with sensitive data redacted), execution status, and latency. A unique Trace ID helps correlate actions across distributed systems. To ensure integrity, audit logs should be tamper-proof, using WORM storage or cryptographic hashing. As Tetrate points out:
"The autonomous nature of AI agents introduces unprecedented accountability challenges... When an agent accesses sensitive customer data... organizations must be able to answer: Why did the agent take this action?"
These structured logs can be forwarded to SIEM systems for real-time anomaly detection. Employing a tiered storage strategy balances the need to handle high log volumes with long-term compliance requirements.
DreamFactory's Security Features
DreamFactory builds on these practices with features designed to enhance both security and observability. Its identity passthrough, robust audit logging, and seamless integration with OAuth 2.0, LDAP/AD, and SAML/SSO ensure that every access is securely tracked. This detailed logging supports HIPAA's requirements and aligns with GDPR's focus on transparency in automated decisions.
DreamFactory also includes built-in threat protection, which monitors access patterns to block suspicious activity. Row-level security ensures that agents can only access data they are authorized to view.
Its comprehensive audit logging captures every API call in full context and integrates smoothly with tools like Prometheus, Grafana, and SIEM systems. For organizations with specific security needs, DreamFactory offers self-hosted deployment options - including on-premises, air-gapped, private cloud, edge, or hybrid setups - keeping sensitive data and logs within secure environments. Additional features like rate limiting, caching, and server-side scripting allow for custom security policies while mitigating resource exhaustion risks.
These capabilities provide the control and visibility needed to securely operate MCP servers in regulated environments.
Best Practices for Designing MCP Servers with Observability
Incorporating observability into your MCP server from the outset helps avoid the "black box" issue that can complicate production systems. By designing with specific metrics and logging across transport, tool, and agent layers, you can detect and address failures early, preventing them from escalating. These practices complement the logging and monitoring strategies discussed earlier.
Using Structured Logging and Custom Metrics
JSON-formatted logs are a must-have for MCP servers. They allow for efficient searching, filtering, and analysis, which is critical given the unpredictable behavior of AI agents. Including metadata like connectionId, requestId, and toolName in your logs ensures you can trace requests and monitor key metrics effectively. For example, 73% of outages begin with unnoticed handshake failures.
Standard application performance monitoring tools often fall short for MCP systems. Instead, custom metrics are needed to track how reliably agents interact with your tools. Focus on handshake and execution metrics, especially for high-traffic tools, to enhance performance. Monitoring token usage per call can reveal optimization opportunities, potentially reducing costs by as much as 10 to 100 times.
If you're using STDIO transport, avoid writing logs to standard output, as it can disrupt the protocol stream. Instead, write logs to standard error (stderr) or use file-based logging. Always ensure sensitive information like API keys or personally identifiable information (PII) is redacted before logs are exported.
Server-Side Scripting for Better Control
Server-side scripting gives you more control over monitoring and system behavior by enabling custom transformations, parameter validation, and business logic. Languages such as PHP, Python, and Node.js are well-suited for these tasks.
Middleware or decorators can be used to intercept tool calls, allowing you to attach tool-specific labels to metrics. This approach addresses the challenge of MCP servers often exposing only a single endpoint (e.g., /mcp), which can make it hard to identify which tool is being called through standard API monitoring. A centralized metrics registry can dynamically manage these metrics without creating tight coupling between tools.
Scripts can also establish intelligent defaults to improve agent reliability. For instance, setting default values for timestamps (e.g., defaulting to the last hour) can prevent invalid data submissions from large language models (LLMs). Similarly, truncating tool responses to the top 10–20 items avoids slowing down the model or exceeding context limits. These guardrails enable systems to recover autonomously 70–80% of the time, compared to only 30–40% without them. Additionally, server-side scripting enhances security by ensuring only validated data flows into your observability stack.
DreamFactory supports this approach by enabling custom business logic at the API layer. This includes parameter validation, data transformations, and logging, all while maintaining the security and audit trails required for compliance.
Connecting Observability with SIEM and BI Tools
Exporting logs and metrics to SIEM and BI platforms facilitates forensic analysis and automated alerts. By using structured JSON logs with standardized fields like trace_id, span_id, session_id, and cost_usd, you can streamline this integration.
SIEM tools are particularly useful for identifying security anomalies in real time. Alerts for agent failures - such as parameter hallucinations or unauthorized access - can mitigate risks immediately. Severity-based policies can log minor issues while blocking high-severity violations to prevent significant damage. It's worth noting that 5.5% of open-source MCP servers have protocol-specific vulnerabilities, such as tool poisoning.
BI platforms, on the other hand, are invaluable for capacity planning and cost analysis. Exporting data on tool usage and token costs helps you identify which AI features are worth the investment and which are resource-intensive. Using OpenTelemetry collectors as a buffer between your MCP servers and monitoring backends ensures smooth data routing and helps avoid network issues - all without requiring changes to your server code.
DreamFactory simplifies SIEM and BI integration with its complete audit logging, capturing every API call with full context. Its compatibility with tools like Prometheus, Grafana, and major SIEM platforms allows you to forward structured logs without needing custom integration. For air-gapped or on-premises deployments, DreamFactory ensures observability data remains secure within your infrastructure while still supporting enterprise monitoring tools.
Lastly, adhere to OpenTelemetry semantic conventions for Generative AI by using attributes like gen_ai.tool.name and mcp.server.name. This standardization makes it easier to compare performance across MCP servers and detect system-wide trends.
Conclusion
Operating MCP servers without observability is like flying blind - failures and vulnerabilities go undetected, leaving your systems exposed. For production-grade MCP servers, structured logging, real-time metrics, and distributed tracing are non-negotiable. These tools provide the visibility needed to detect issues, optimize performance, and maintain security.
The risks are very real. Back in February 2026, researchers uncovered 341 malicious skills on a major MCP marketplace, loaded with prompt injection payloads and credential harvesters. Without observability, such threats can linger unnoticed until the damage is done.
Performance also hinges on visibility. One development team managed to slash MCP context output by an incredible 98% - their most impactful performance gain. Achievements like this are only possible when you're actively monitoring metrics like context window usage, token consumption, and latency. These optimizations go hand-in-hand with the secure and compliant infrastructure today's environments demand.
Beyond performance, observability ensures regulatory compliance through tamper-proof audit trails. Tools like DreamFactory make this achievable with features like complete audit logging, identity passthrough, and seamless integration with monitoring solutions such as Prometheus and SIEM platforms. All of this happens while keeping your data securely within your infrastructure.
Observability is the backbone of MCP server design, tying together performance, security, and scalability. By using OpenTelemetry tracing, structured JSON logs, and Streamable HTTP for session management, you gain the transparency and control needed for reliable, production-grade AI systems.
"AI agents are only as reliable as the tools they call. If you can't see what your MCP servers are doing, you can't make your agents reliable." - Jamie Mallers, OneUptime
Your AI agents depend on the tools they call - and those tools need observability built in from the start.
FAQs
What’s the fastest way to add observability to an MCP server?
The fastest way to bring observability to an MCP server is by implementing OpenTelemetry for tracing and monitoring. Begin by incorporating OpenTelemetry SDKs directly into your server's codebase. This enables you to monitor latency, errors, and critical metrics effectively. With proper configuration, you can capture essential data to gain real-time insights into your server's performance. This approach helps identify bottlenecks, detect failures, and address security concerns, ensuring your server operates reliably in a production environment.
How can I trace an agent session across multiple tool calls?
To follow an agent session across several tool calls, rely on structured logging and distributed tracing. Activate OpenTelemetry to generate spans for workflows and tool calls. Use trace IDs to connect these spans throughout the session, and include the same IDs in structured logs to link traces with logs. This method provides clear insights into the session's flow, making it easier to debug and analyze.
Which MCP metrics should I alert on first in production?
To keep things running smoothly, keep an eye on key MCP metrics like response times, error rates, and tool call patterns. Pay close attention to request latency and error rates, as these can help you quickly spot slow or failing tool calls that might hurt performance. Also, monitor tool call metadata and usage patterns to catch any unusual or suspicious behavior early. By focusing on these areas, you can address latency problems, failures, or potential security concerns before they escalate in production.