Terence Bennett - April 20, 2018DreamFactory has had support for Logstash since version 2.3 for our Gold Tier version. Elastic makes some great tools to support very robust logging. Incorporating Elasticsearch, Logstash and Kibana into your powerful, scalable DreamFactory instance is a no brainer, especially for users who have a lot of data being pushed and pulled through various endpoints. This will make the lives of your admins so much easier with the amount of detail they can grab to troubleshoot issues.
In the past we had shipped these products as part of our install packages, but now we require you to install these products yourself where it makes the most sense in order to optimize your production environments. Let’s dig into the good stuff and get you up and running!
In order to take advantage of the ELK stack, you need to download and install all three components if you want to run them locally. They also have cloud install options, but that will be out of the scope of this post. You can still connect those instances to DreamFactory and if you need any assistance, please reach out to our support team! Make sure you are cognizant of which versions you are downloading. 6.X introduced a number of features that will break anything on 5.X. There are a couple of ways you can do this. You can go the Homebrew route if on Mac or Linux based systems, or you can download them directly from the Elastic site if using Windows. Their documentation is very good should you choose to go that route.
Before you install these tools, check to see if you have the Java 8 SDK installed in order for the ELK stack to run. You can easily check to see if you have it installed by typing
java -version
into your terminal window. If you don’t see something like this:
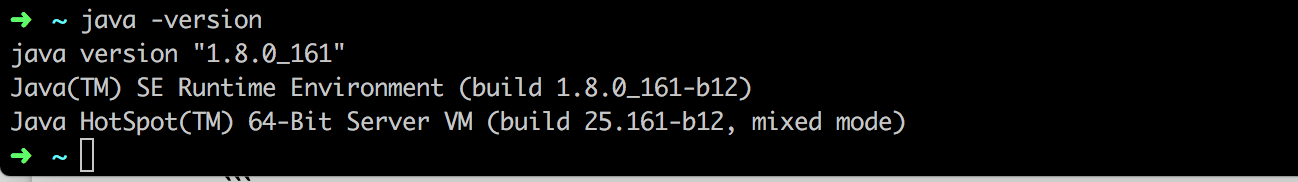

You will need to head to the Java installation page right here.
Using Homebrew to install these components is very fast and straightforward. If you do not have Homebrew installed you can do so in your terminal window:
/usr/bin/ruby -e "$(curl -fsSL https://raw.githubusercontent.com/Homebrew/install/master/install)"
Make sure it is updated:
brew update
Installing Elasticsearch
Now that we’ve made sure our system and environment have the required pieces in place, we can begin with installing the stack’s components, starting with Elasticsearch:
brew install elasticsearch && brew info elasticsearch
brew services start elasticsearch
Start Elasticsearch with Homebrew:
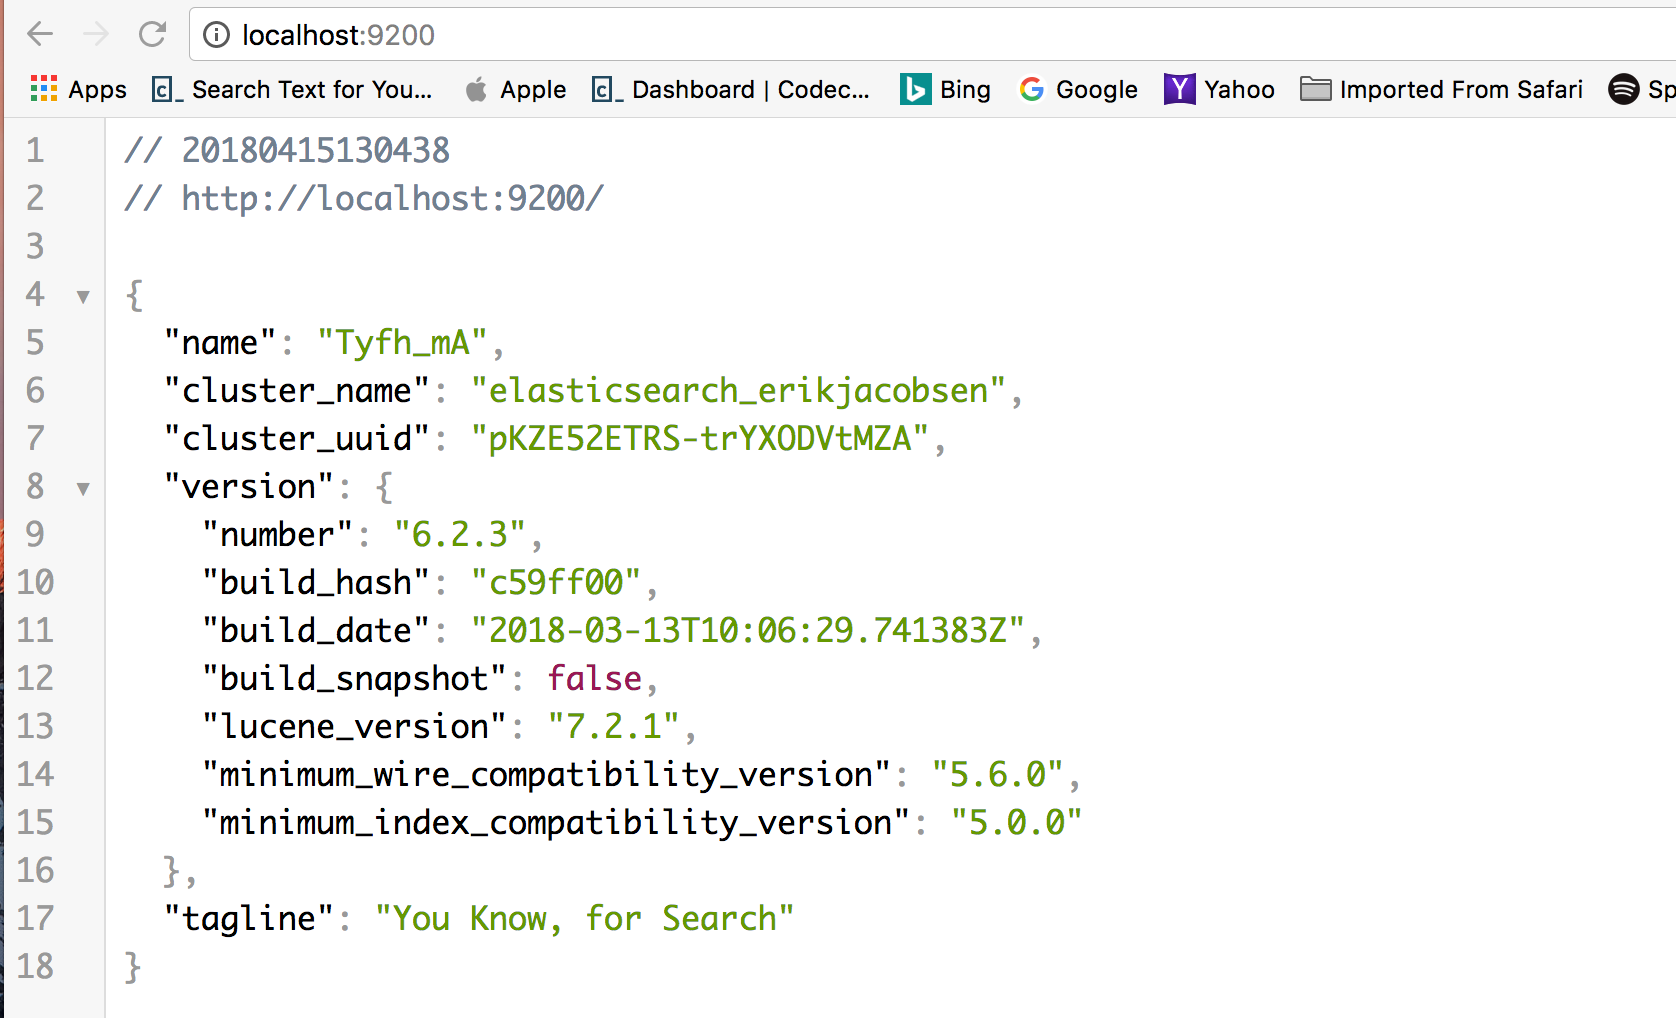
Use your favorite browser to check that it is running correctly on localhost and the default port: https://localhost:9200
The output should look something like this:
Installing Logstash
Your next step is to install Logstash:
brew install logstash
You can run Logstash using the following command:
brew services start logstash
Since we haven’t configured a Logstash pipeline yet, starting Logstash will not result in anything meaningful. We will return to configuring Logstash in another step below.
Installing Kibana
Finally, let’s install the last component of ELK, Kibana.
brew install kibana
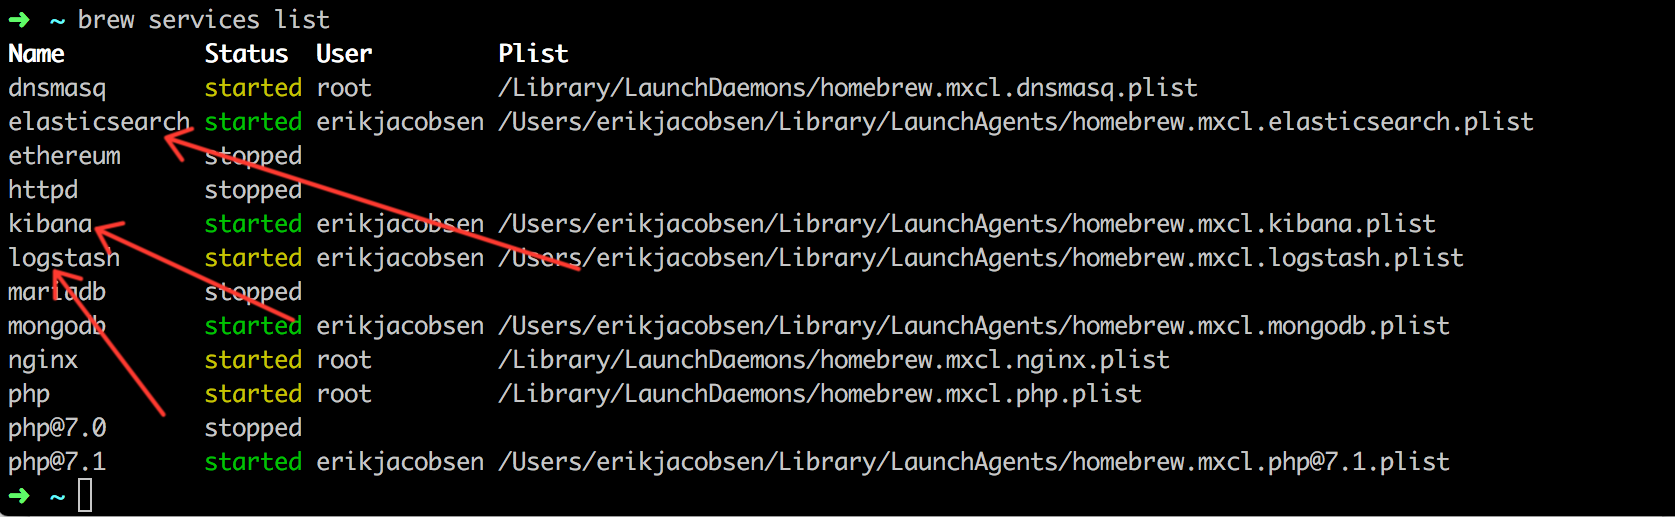
Start Kibana and check that all of ELK services are running.
brew services start kibana
brew services list
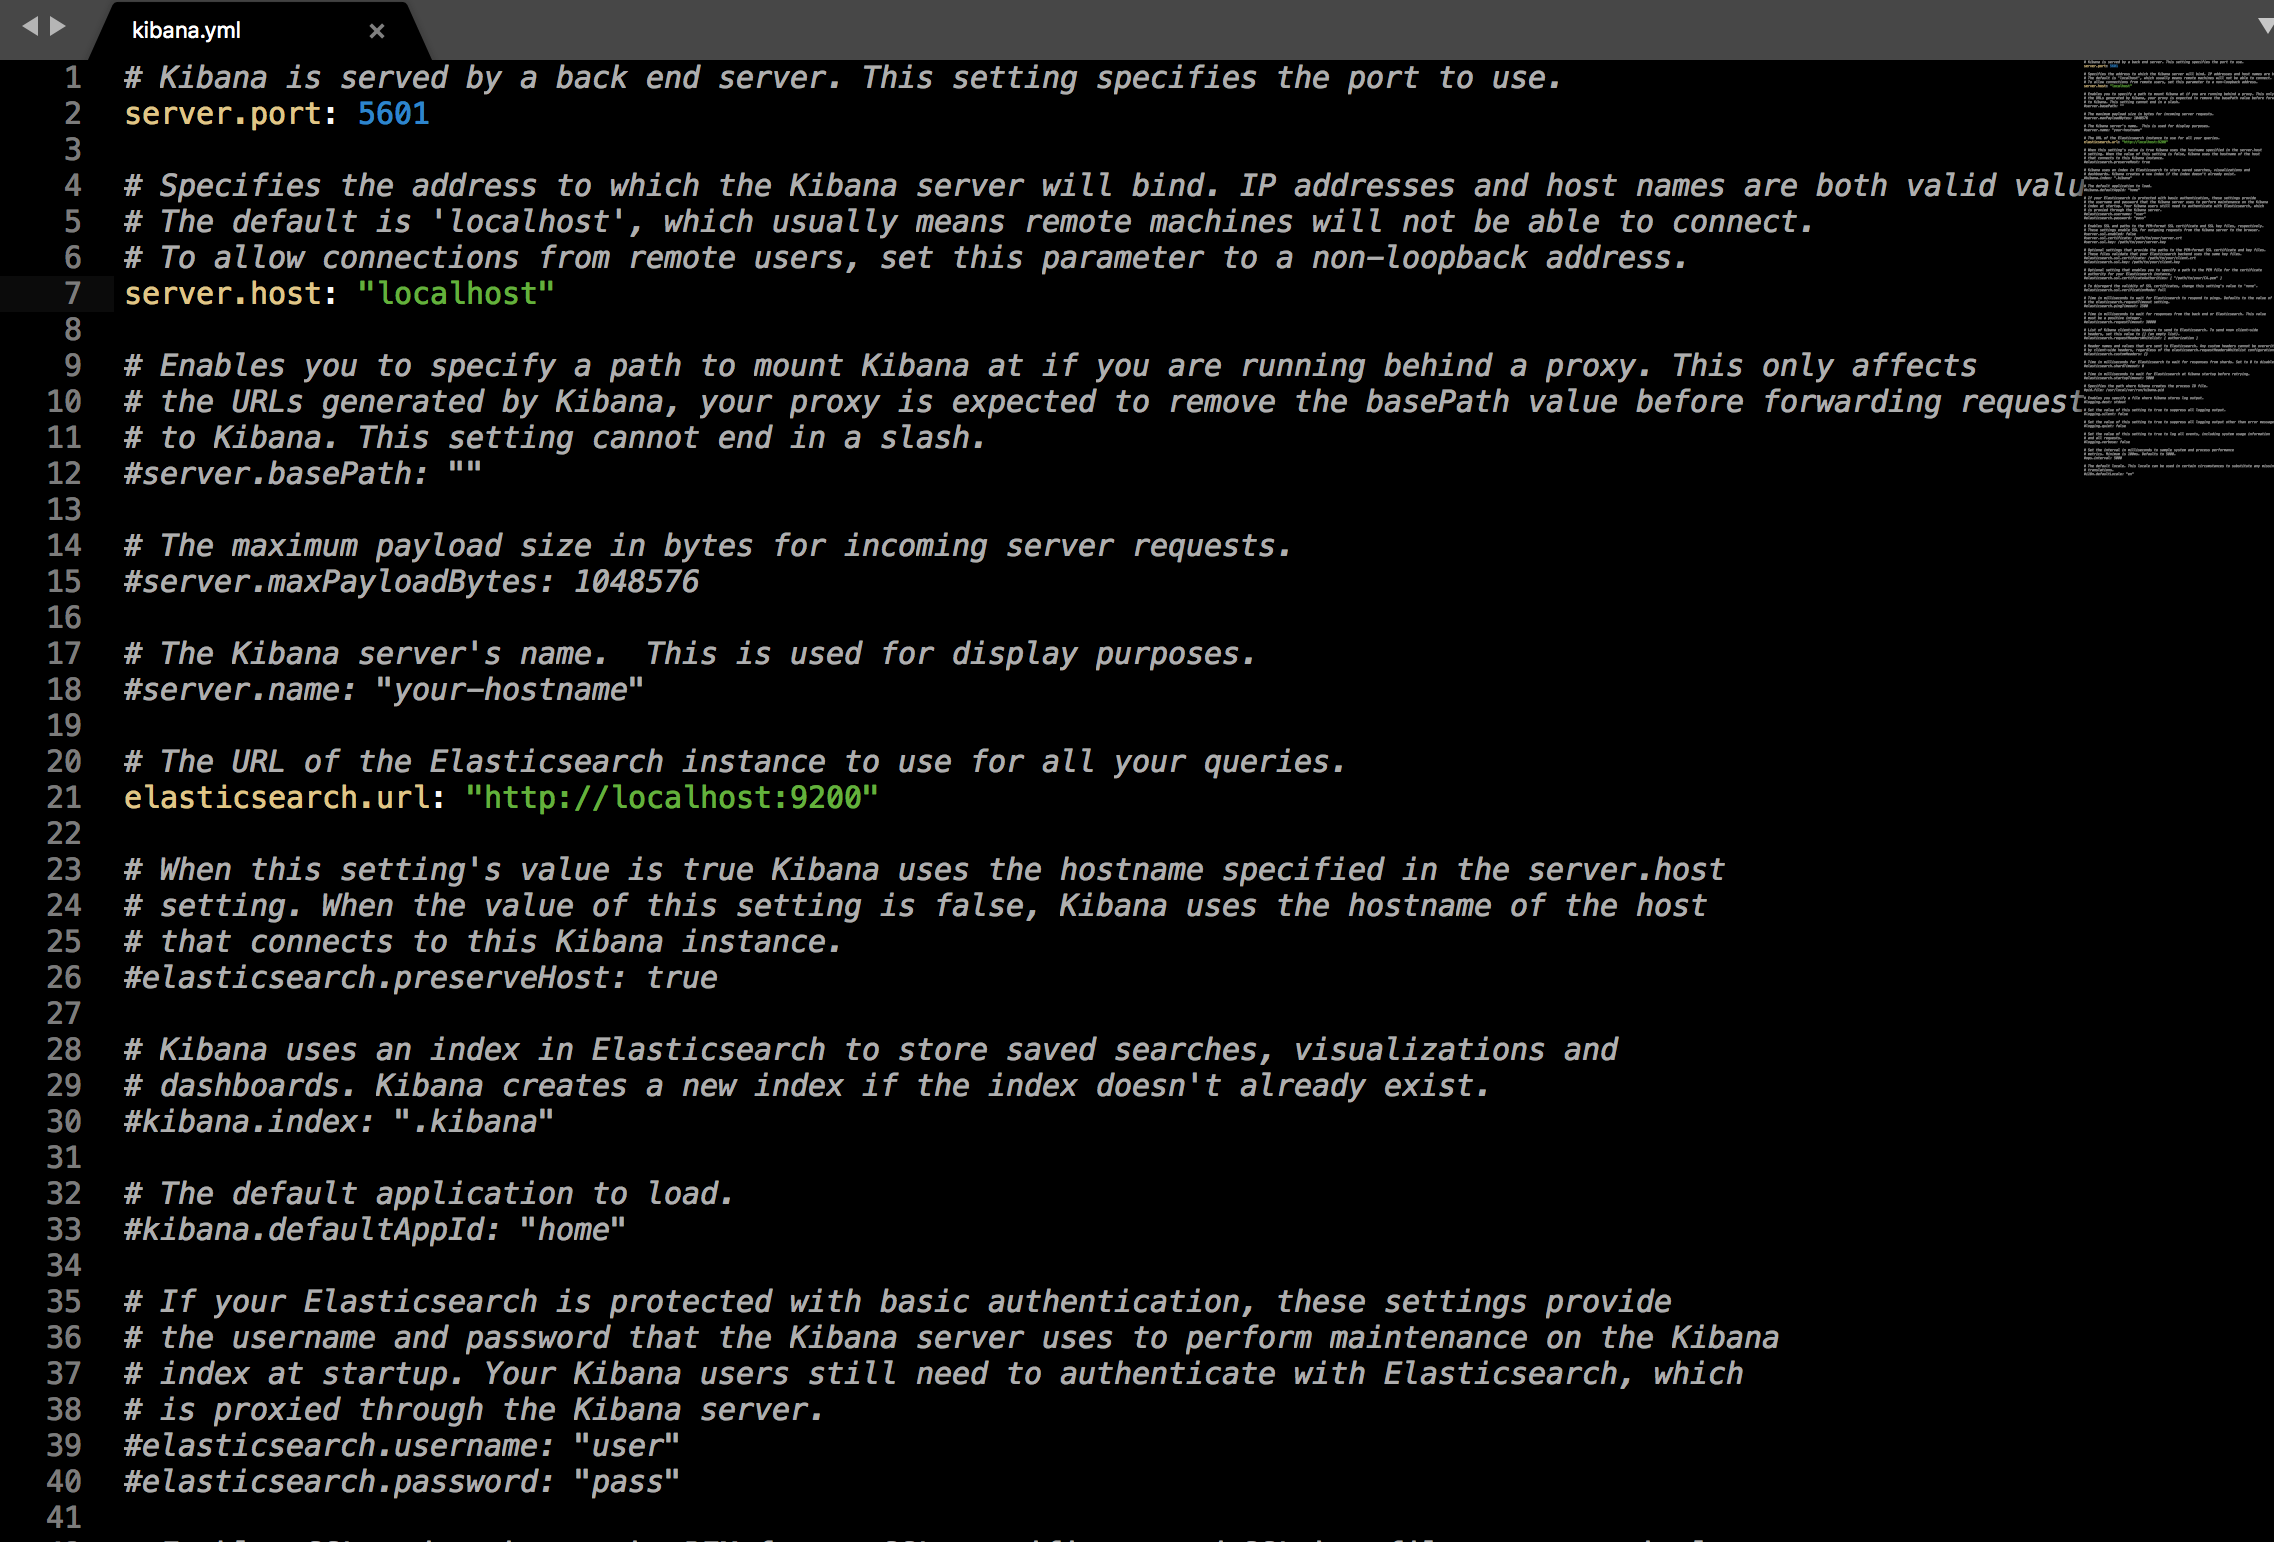
Kibana will need some configuration changes to work.
Open the Kibana configuration file: kibana.yml
sudo vi /usr/local/etc/kibana/kibana.yml
Uncomment the directives for defining the Kibana port and Elasticsearch instance by deleting the preceding #. See the image below:
If everything went well, open Kibana at https://localhost:5601/status. You should see something like this:
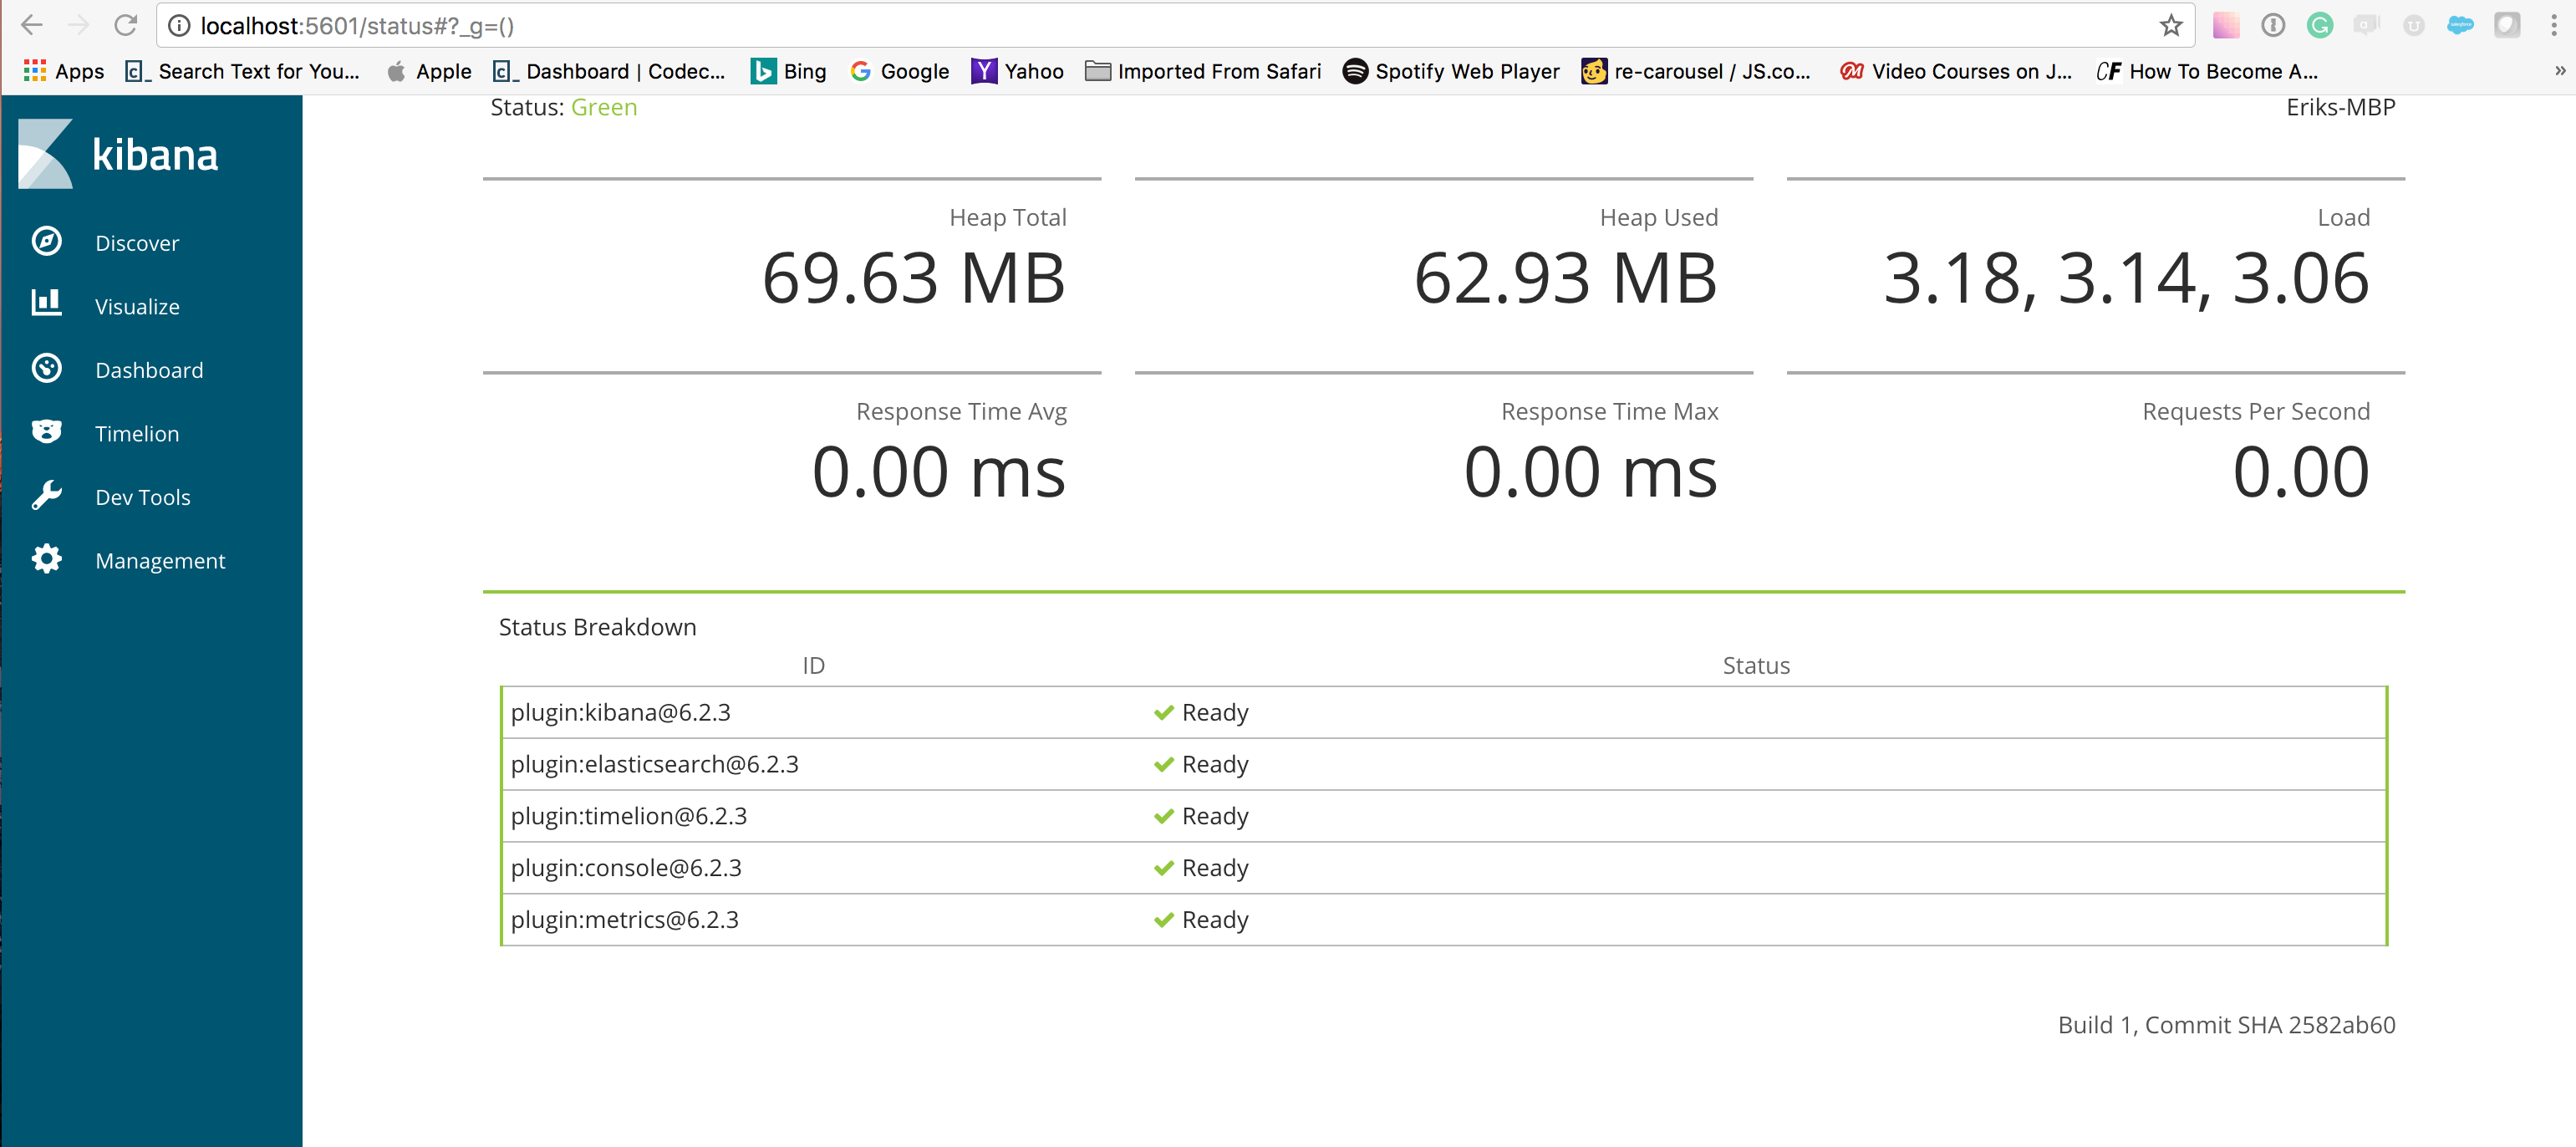
Boom, ELK is installed! But, now what?
Since this is a vanilla installation, you have no Elasticsearch indices to analyze in Kibana. We will take care of that in the next step.
Connecting to DreamFactory and Passing Some Data Through Your ELK Stack
You are ready to start sending data into Elasticsearch and enjoy all the goodness that the stack offers. To help you get started, here is an example of a Logstash pipeline sending event logs into the stack. This is a very basic example in order to make sure I have the appropriate connection points accounted for when I connect this stack with DreamFactory.
First, you will need to create a new Logstash configuration file and put it in the same directory as your Logstash installation:
input
{
    beats
    {
        ssl => false
        host => "0.0.0.0"
        port => 5044
    }
    gelf{

        host => "0.0.0.0"
        port => 12201
    }
    http{

        ssl => false
        host => "0.0.0.0"
        port => 8888
    }
    tcp{

        mode => "server"
        host => "0.0.0.0"
        port => 5010
    }
    udp{

        host => "0.0.0.0"
        port => 5000
    }
}
output{
    elasticsearch{

        hosts => ["127.0.0.1:9200"]
        index => "logstash-%{+YYYY.MM.dd}"
    }

}
Then, restart the Logstash service:
brew services restart logstash
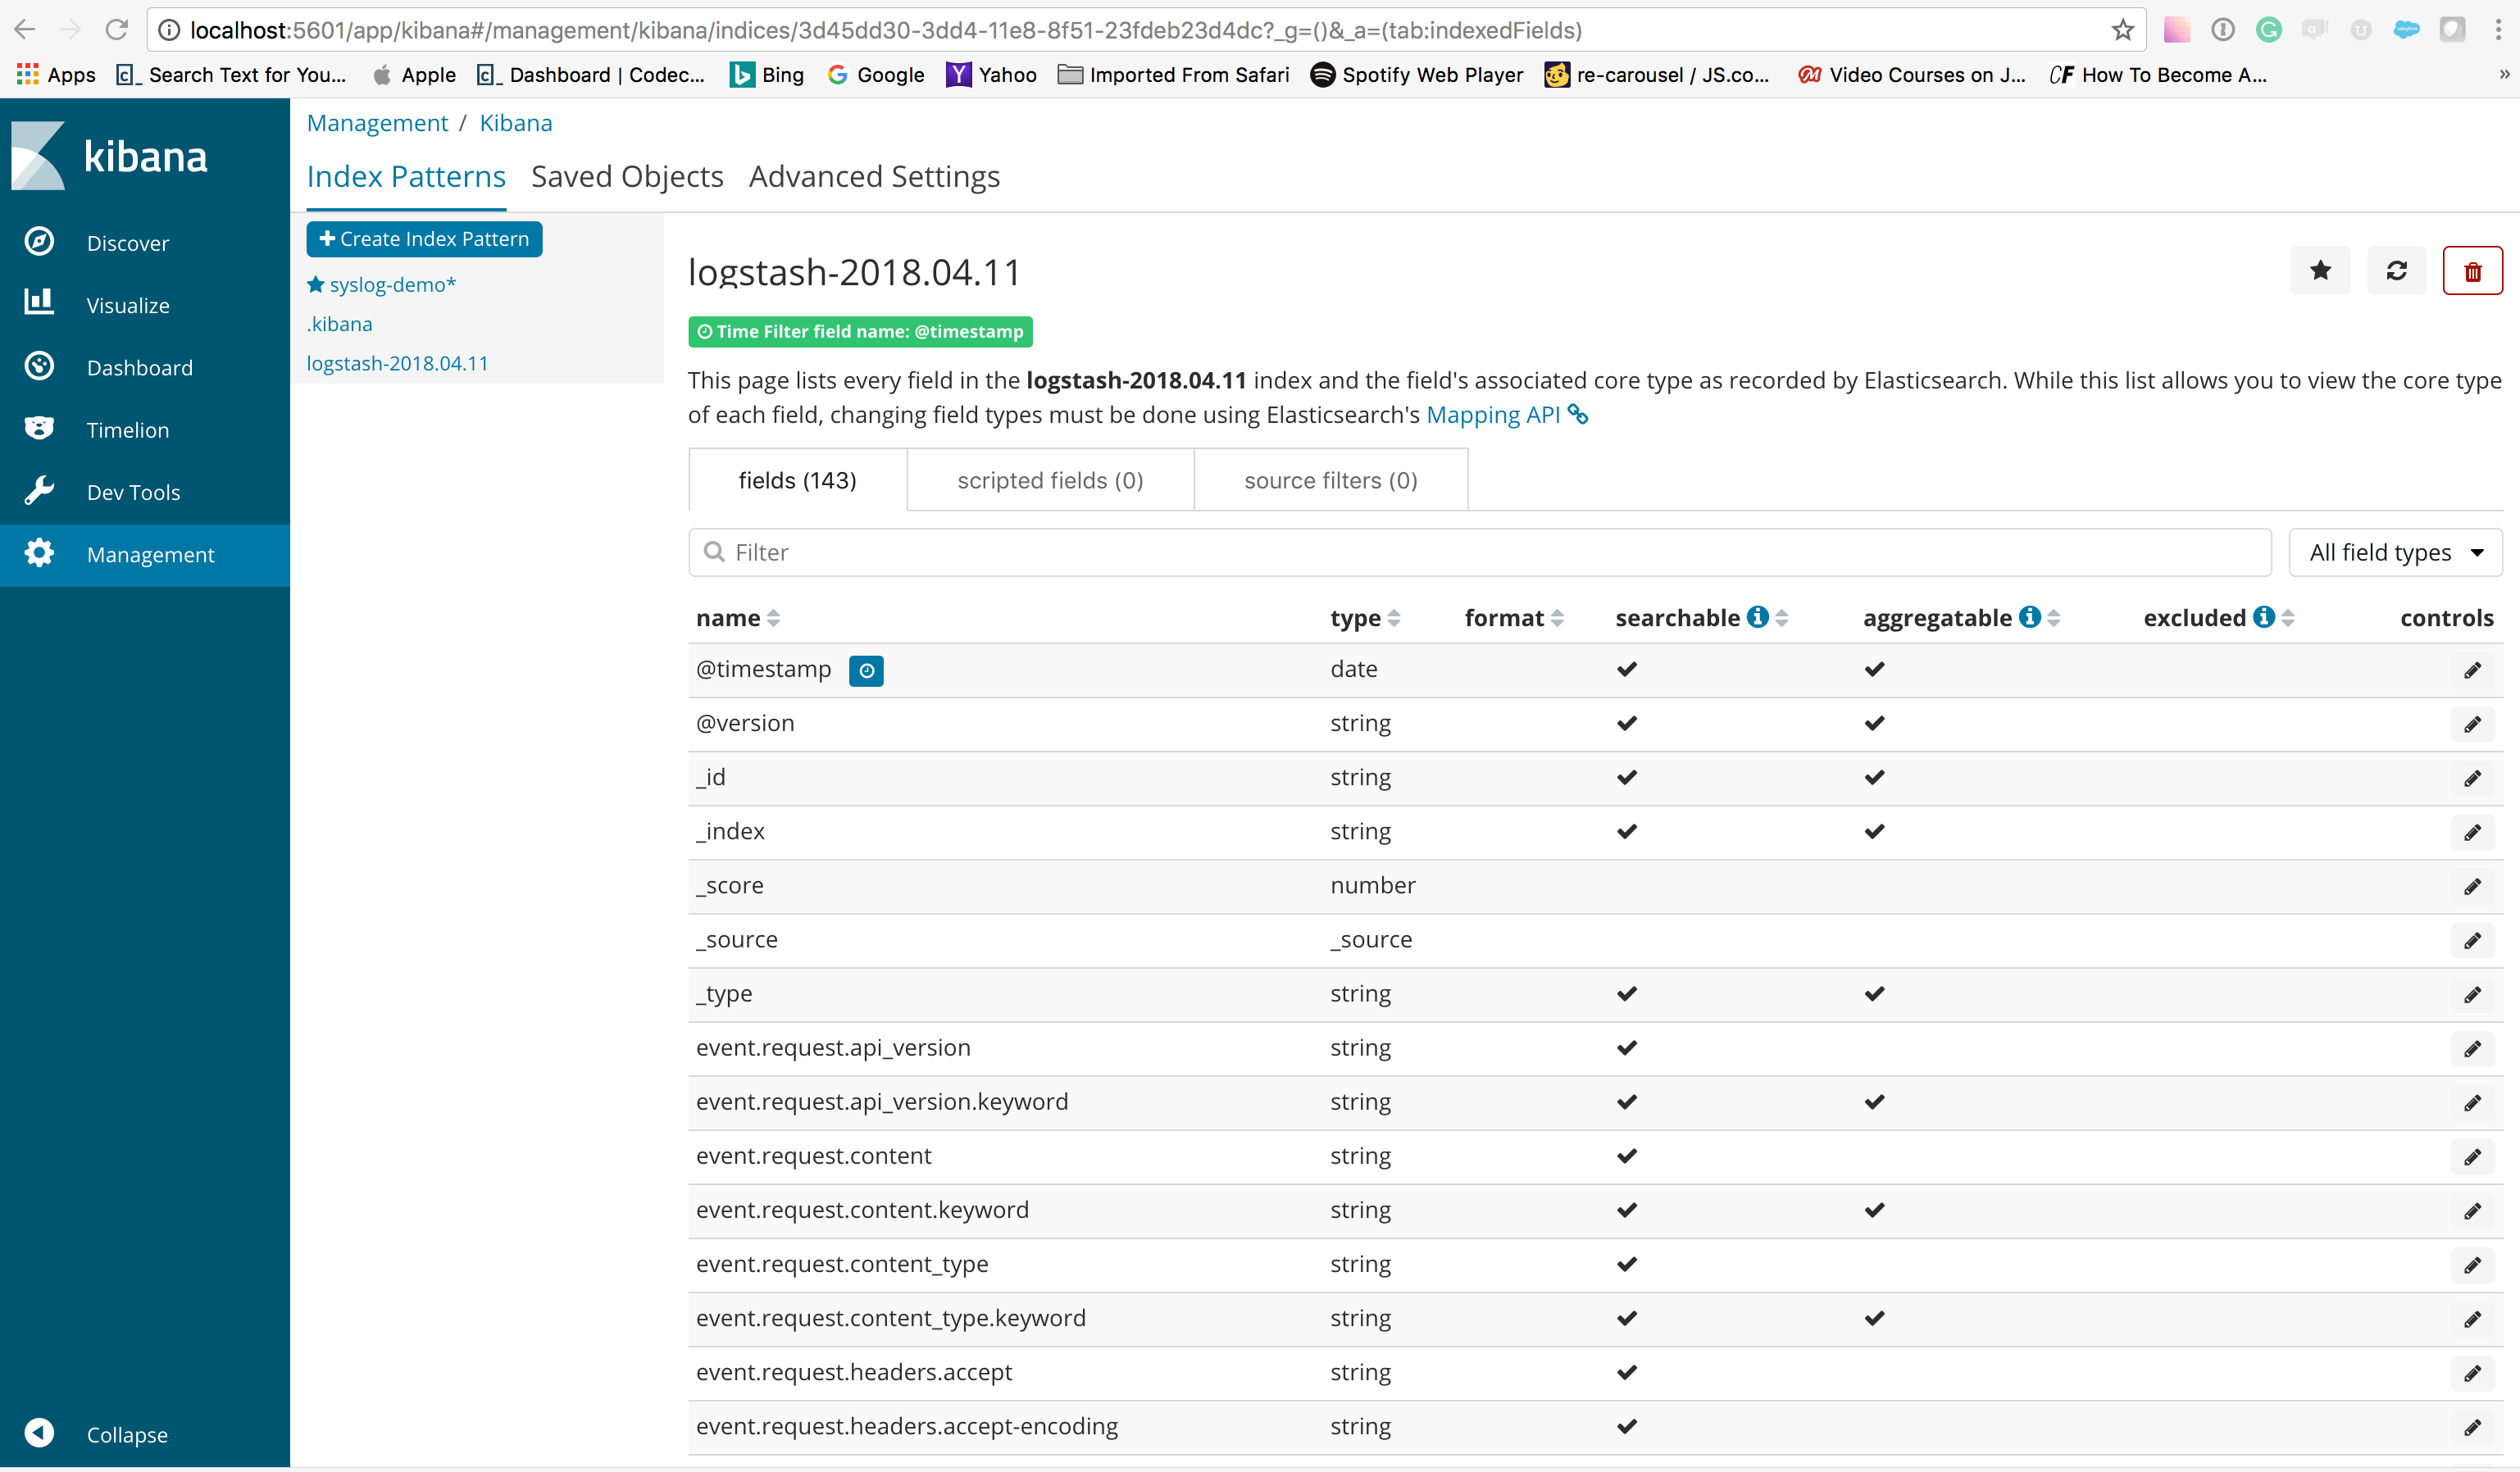
In the Management tab in Kibana, you should see a newly created index (logstash-2018.04.11, in this case) created by the new Logstash pipeline. You can see in the output object in the logstash.conf file how we obtain the index value. Enter this as an index pattern, and in the next step select the @timestamp field as your Time Filter field name.
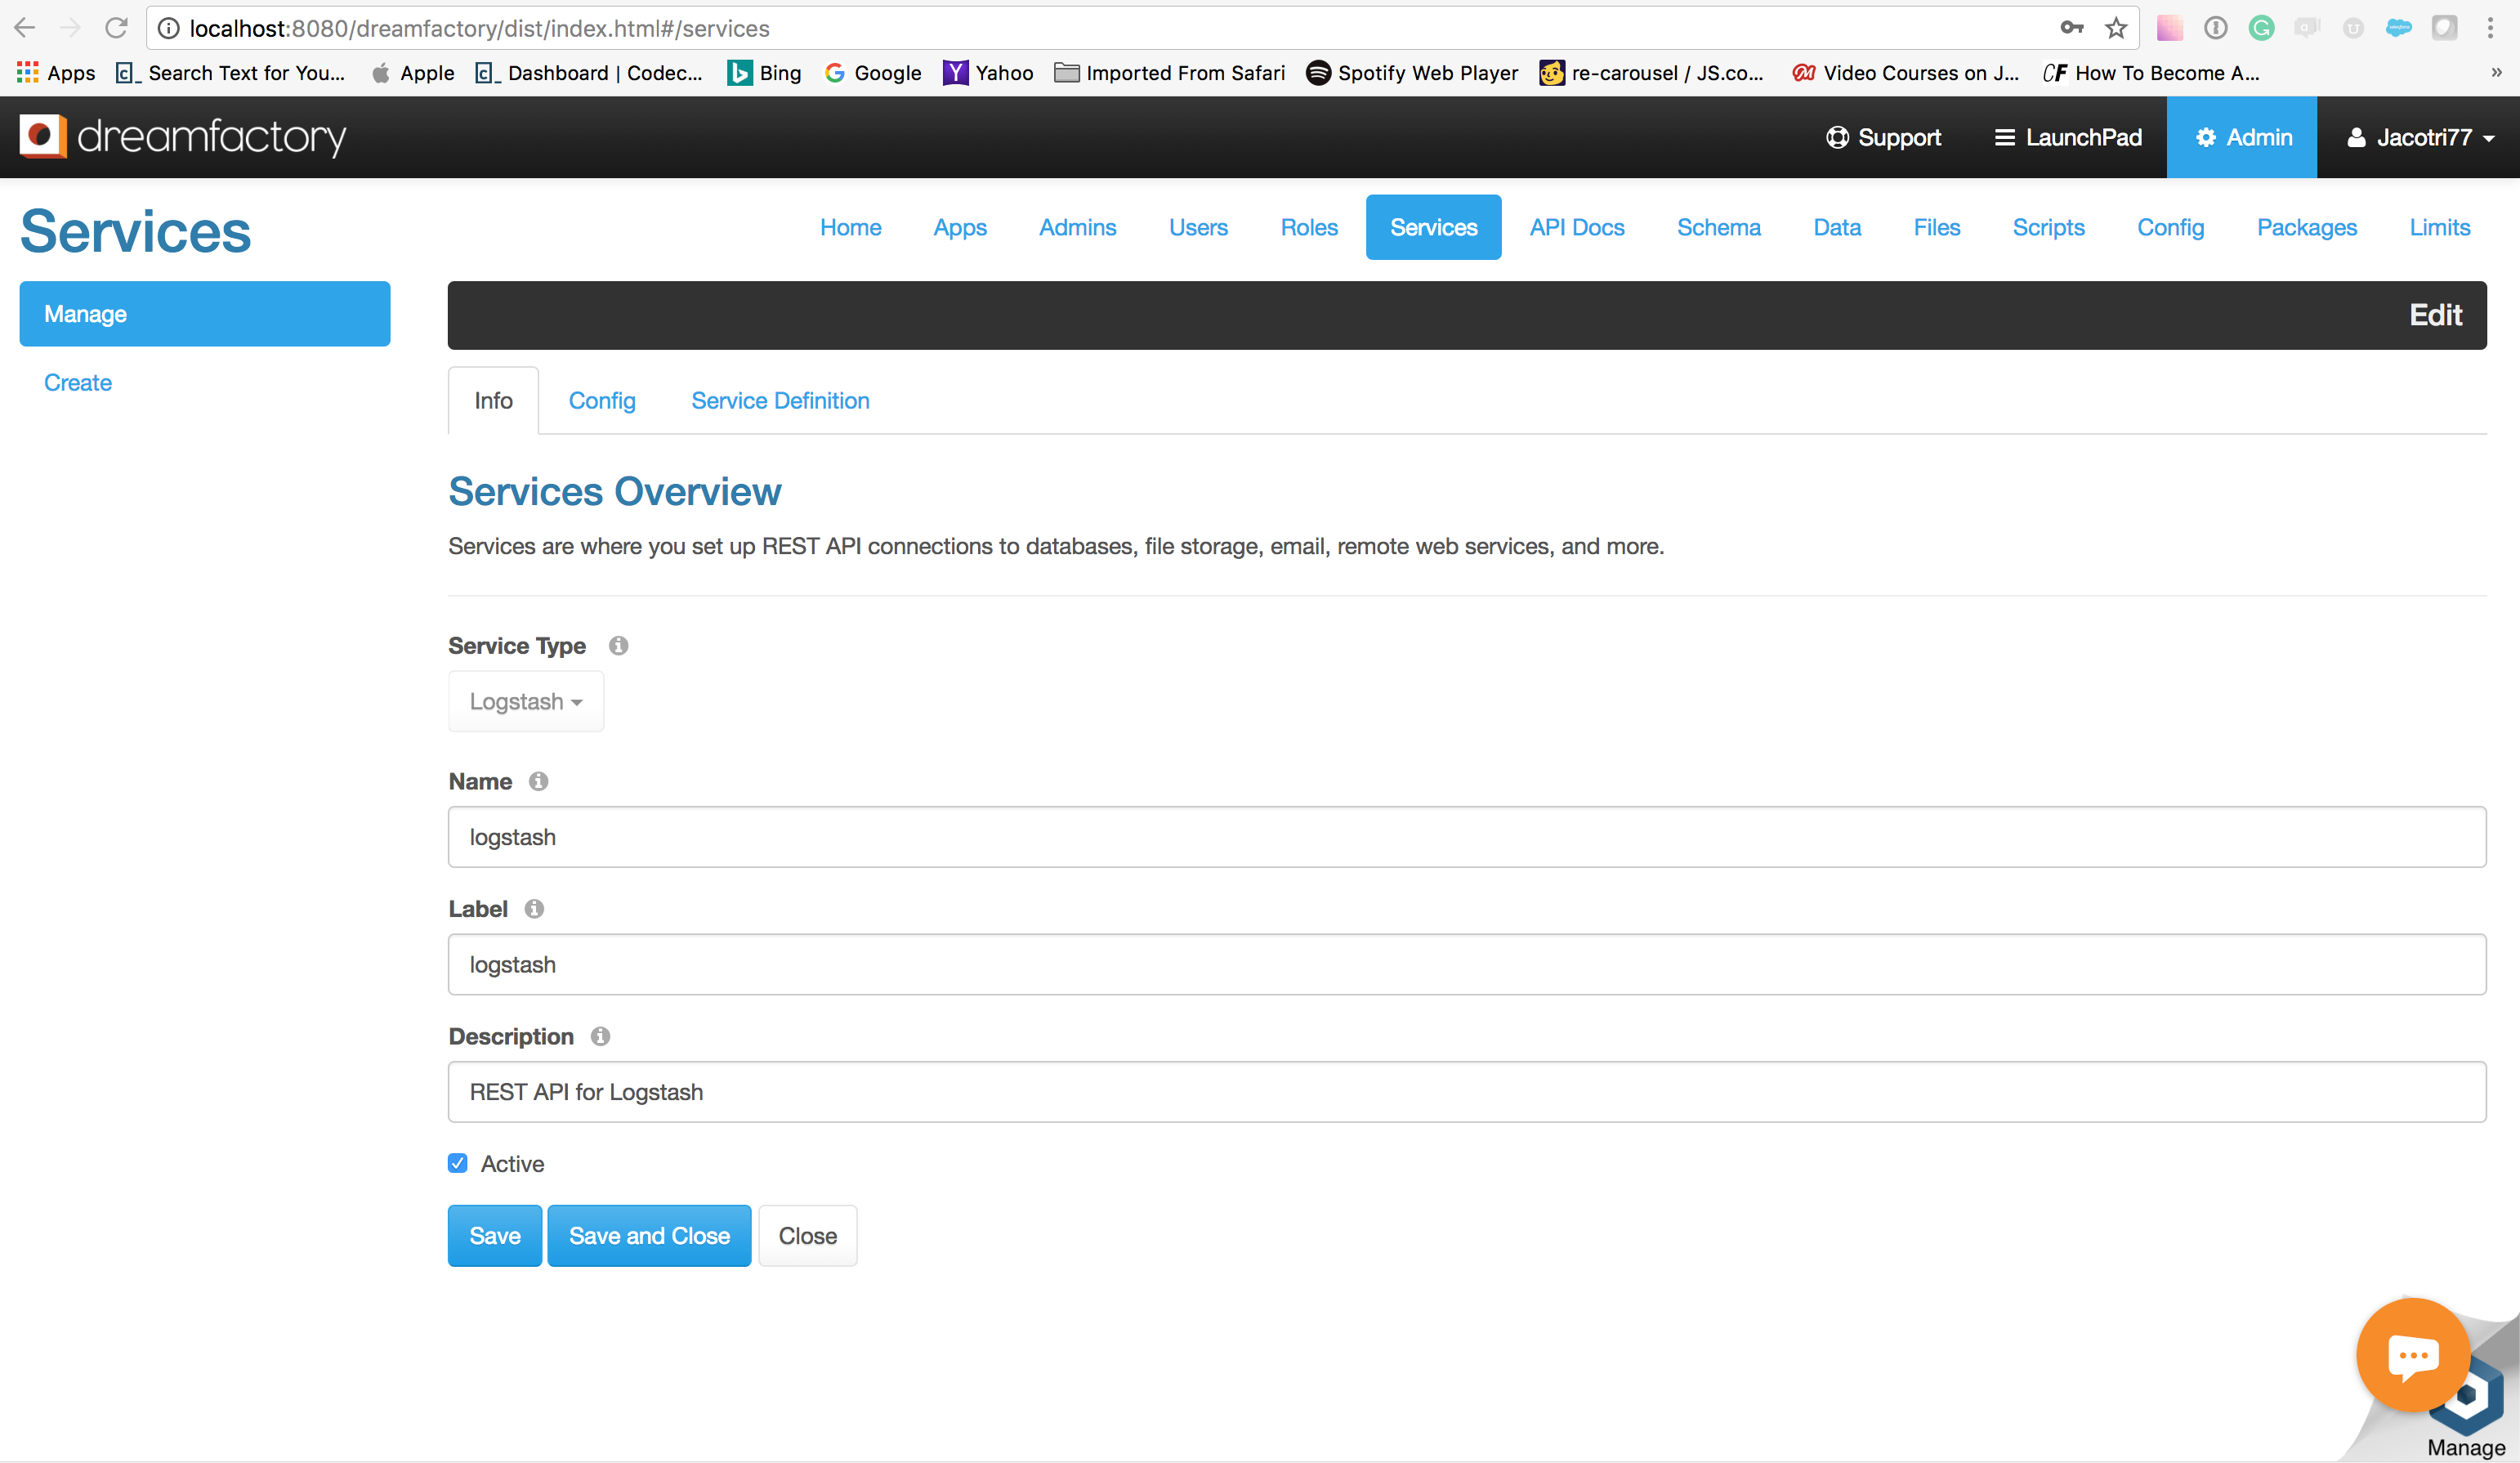
OK, now we need to make the data flow from DreamFactory and into your new pipeline. This is the easy part. Create a new service inside of the DreamFactory admin interface as I have below:
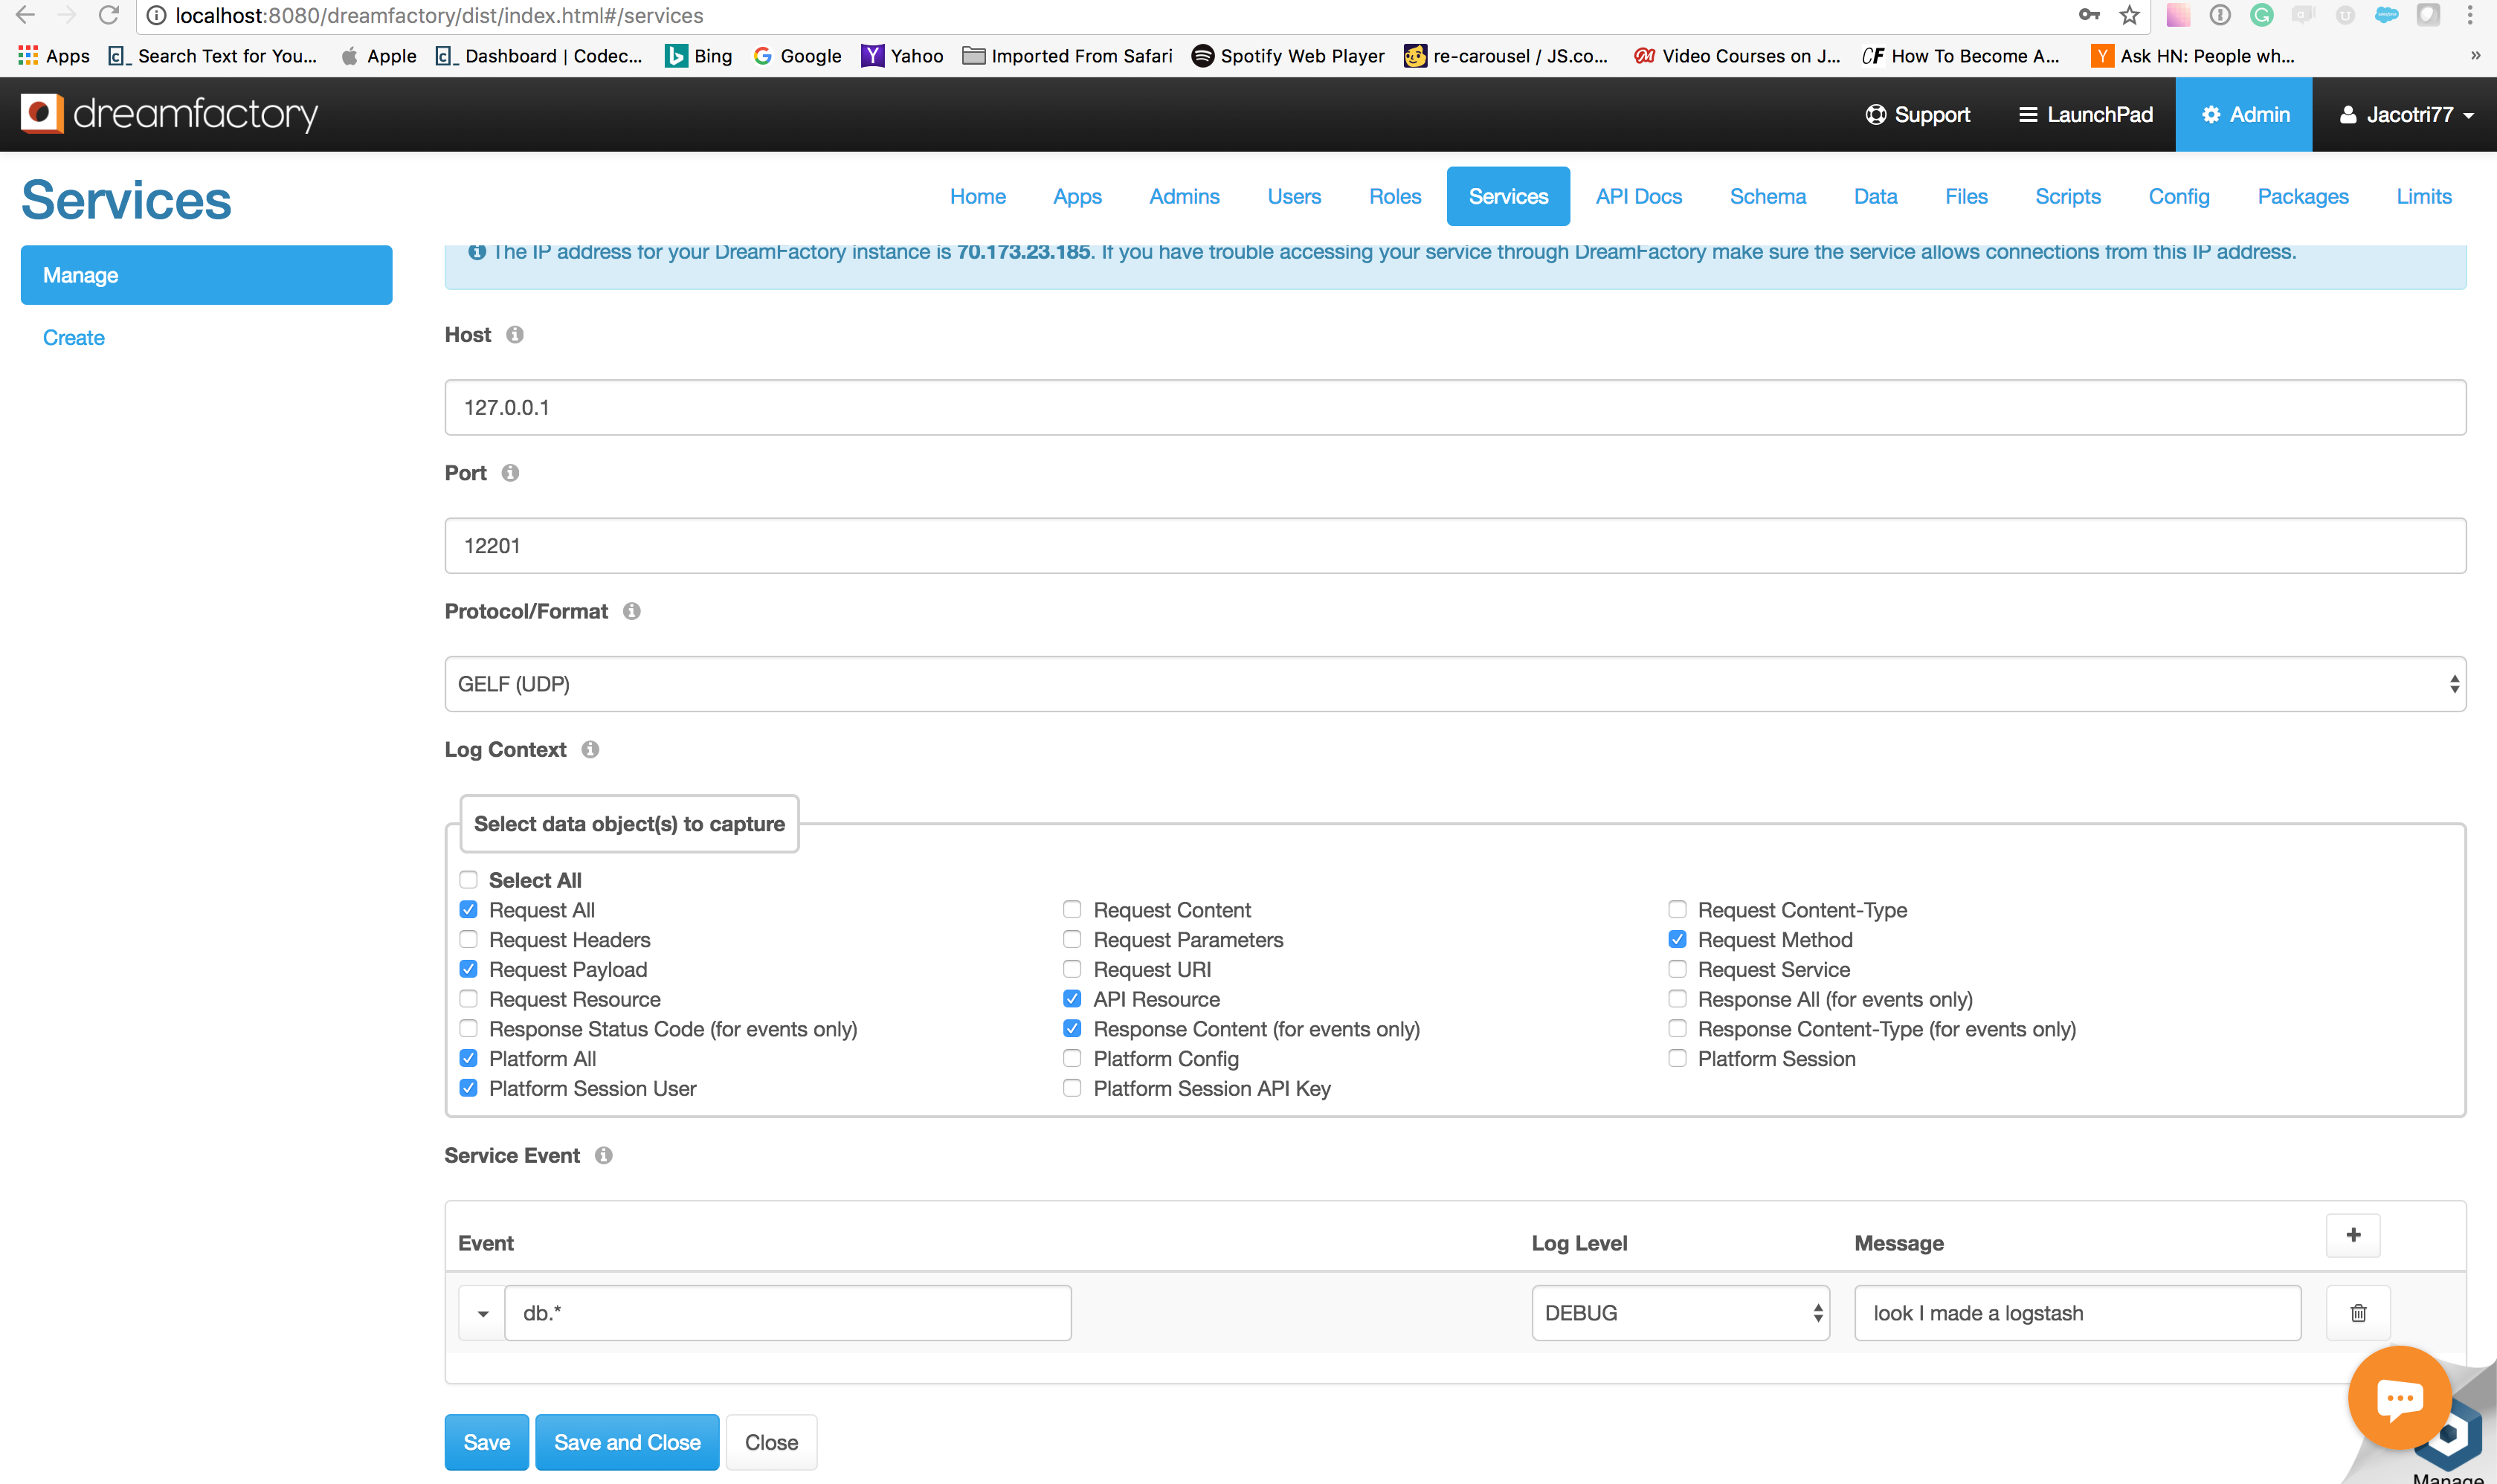
Then hop over to the config tab of your new service and add in the appropriate listening host, port, and format. You will also be selecting what you would like to log. As you can see in the screenshot below, there is an extensive list of logging capabilities. You can create various service events you want to watch.
When you create a service event it will send detailed information to your Kibana application when the service event is invoked (the api endpoint is hit) where you can create a myriad of detailed graphs, charts, and reports. Take a look below at some sample results:
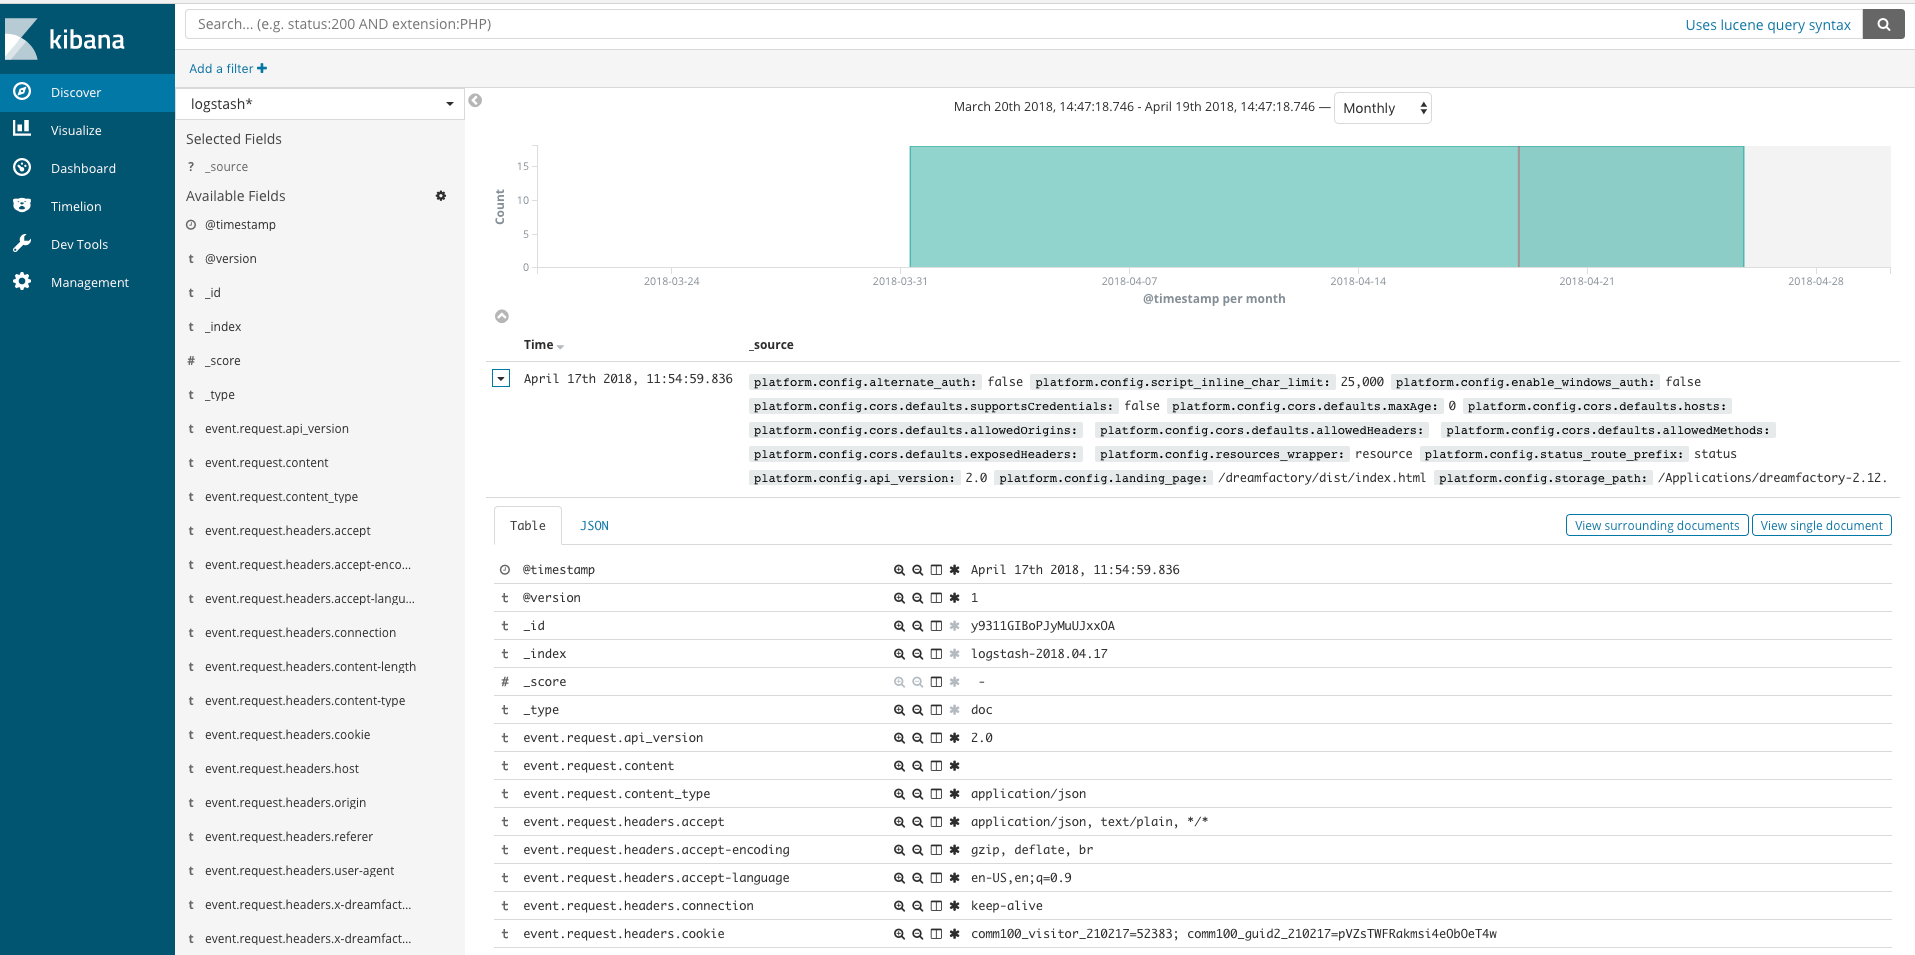
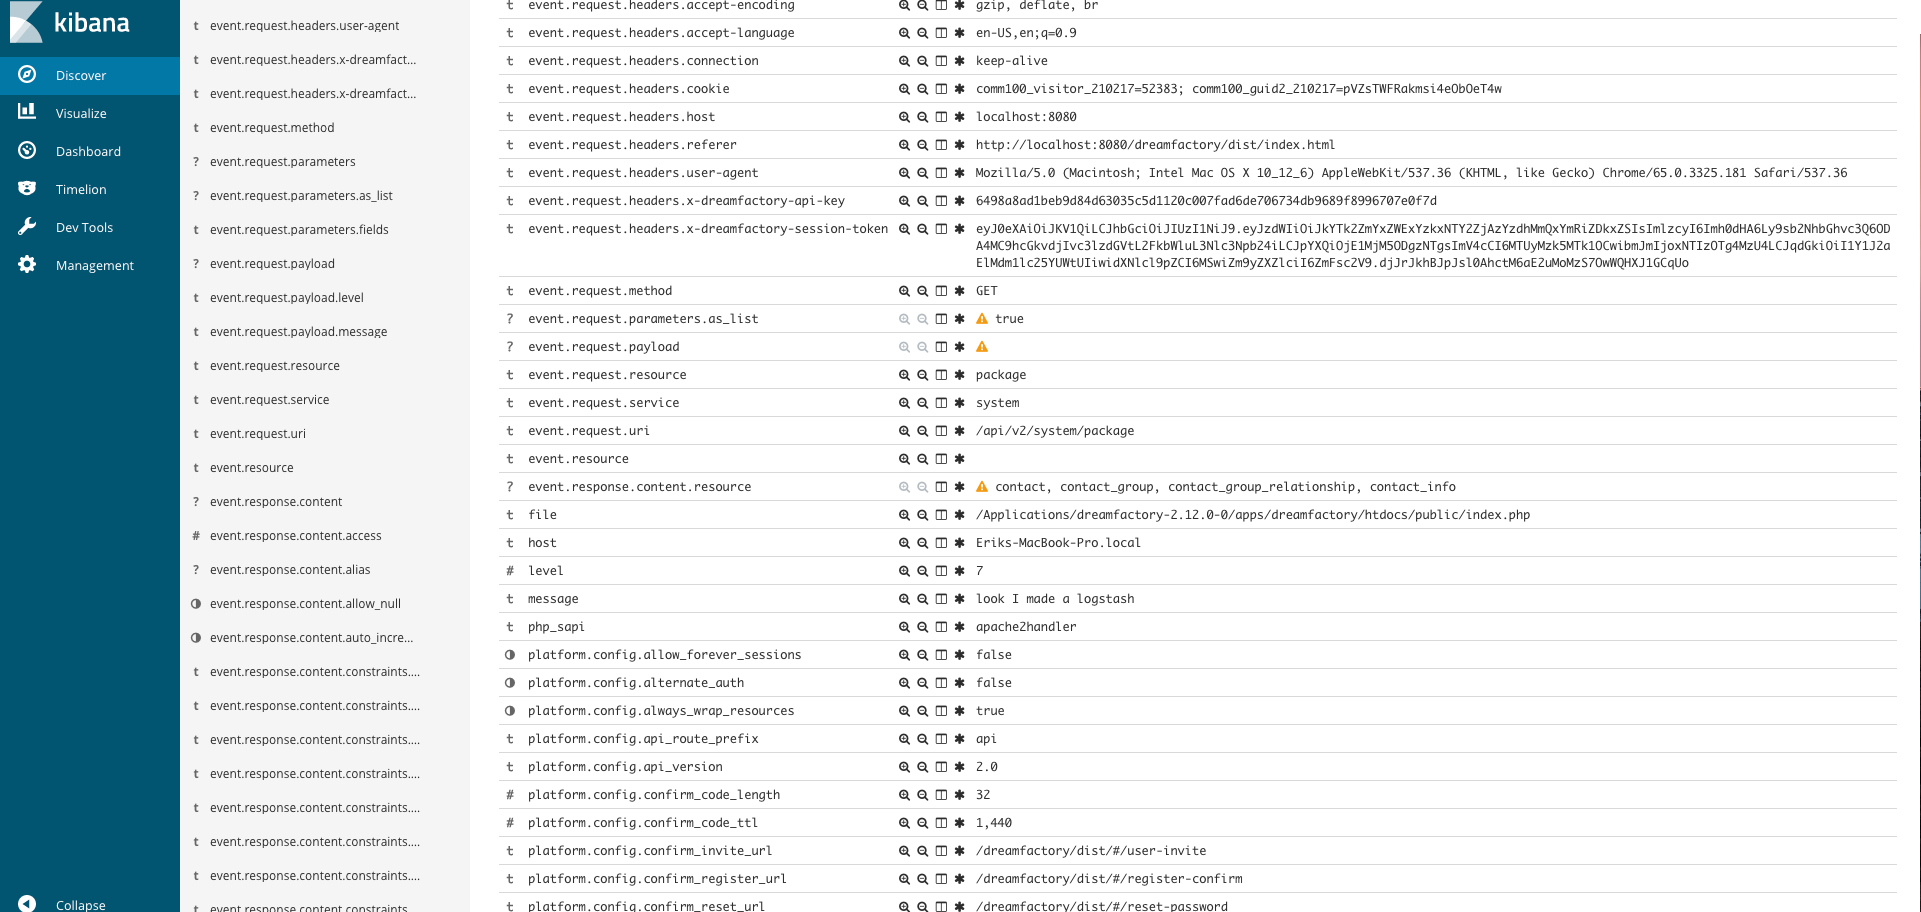
You can see just how much information the ELK stack will provide. Hopefully you are paid up on your quarterly taxes and you have no dark secrets locked away in any dark corners. Ha!
Elastico makes a robust program, and in this day and age of data privacy concerns, you now have the ability to track everything about your API calls. If you want to test it out yourself, click the button below and have some fun.
If you like what you read here, give us a shout out on Google and grab a DreamFactory T-Shirt.

Terence Bennett, CEO of DreamFactory, has a wealth of experience in government IT systems and Google Cloud. His impressive background includes being a former U.S. Navy Intelligence Officer and a former member of Google’s Red Team. Prior to becoming CEO, he served as COO at DreamFactory Software.